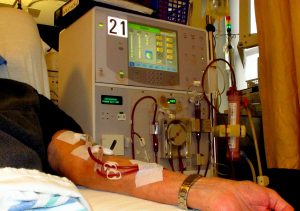
Week 27 – Mortality in Patients on Dialysis and Transplant Recipients

“Comparison of Mortality in All Patients on Dialysis, Patients on Dialysis Awaiting Transplantation, and Recipients of a First Cadaveric Transplant”

N Engl J Med. 1999 Dec 2;341(23):1725-30. [free full text]

Renal transplant is the treatment of choice in patients with ESRD. Since the advent of renal transplant, it has been known that transplant improves both quality of life and survival relative to dialysis. However, these findings were derived from retrospective data and reflected inherent selection bias (patients who received transplants were healthier, younger, and of higher socioeconomic status than patients who remained on dialysis). While some smaller studies (i.e. single center or statewide database) published in the early to mid 1990s attempted to account for this selection bias by comparing outcomes among patients who received a transplant versus patients who were listed for transplant but had not yet received one, this 1999 study by Wolfe et al. was a notable step forward in that it used the large, nationwide US Renal Data System dataset and a robust multivariate hazards model to control for baseline covariates. To this day, Wolfe et al. remains a defining testament to the sustained, life-prolonging benefit of renal transplantation itself.

Using the comprehensive US Renal Data System database, the authors evaluated patients who began treatment for ESRD between 1991 and 1996. Notable exclusion criteria were age ≥ 70 and transplant prior to initiating dialysis. Of the 228,552 patients evaluated, 46,164 were placed on the transplant waitlist, and 23,275 received a transplant by the end of the study period (12/31/1997). The primary outcome was survival reported in unadjusted death rates per 100 patient-years, standardized mortality ratios (adjusted for age, race, sex, and diabetes as the cause of ESRD), and adjusted relative risk of death in transplant patients relative to waitlisted patients. Subgroup analyses were performed.

Results:
Regarding baseline characteristics, listed or transplanted patients were younger, more likely to be white or Asian, and less likely to have diabetes as the cause of their ESRD (see Table 1). Unadjusted death rates per 100 patient-years at risk: dialysis 16.1, waitlist 6.3, and transplant recipients 3.8 (no p value given, see Table 2). The standardized mortality ratio (adjusted for age, race, sex, and diabetes as the cause of ESRD) was 49% lower (RR 0.51, 95% CI 0.49–0.53, p<0.001) among patients on the waitlist and 69% lower among transplant recipients (p value not reported). The lower standardized mortality ratio of waitlisted patients relative to dialysis patients was sustained in all subgroup analyses (see Figure 1). The relative risk of death (adjusted for age, sex, race, cause of ESRD, year placed on waitlist, and time from first treatment of ESRD to placement on waitlist) is visually depicted in Figure 2. Importantly, relative to waitlisted patients, transplant recipients had a 2.8x higher risk of death during the first two weeks post-transplant. Thereafter, risk declined until the likelihood of survival equalized at 106 days post-transplant. Long term (3-4 years of follow-up in this study), mortality risk was 68% lower among transplanted patients than among waitlisted patients (RR 0.32, 95% CI 0.30–0.35, p< 0.001). The magnitude of this survival benefit varied by subgroup but was strong and statistically significant in all subgroups (ranging from 3 to 17 additional projected years of life, see Table 3).

Implication/Discussion:
Retrospective analysis of this nationwide ESRD database has clearly demonstrated the marked mortality benefit of renal transplantation over waitlisted status. This finding is present to varying degrees in all subgroups and leads to a projected additional 3 to 17 years of lifespan post-transplant. (There is an expected, mild increase in mortality risk immediately following transplantation. This increase reflects operative risk and immediate complications but is present for only 2 weeks post-transplantation.) As expected and as previously described in other datasets, this study also demonstrated that substantially healthier ESRD patients are selected for transplantation listing in the US in comparison to patients who remain on dialysis not on the waitlist.

Relative strengths of this study include its comprehensive national dataset and intention-to-treat analysis. Its multivariate analyses robustly controlled for factors, such as time on the waitlist, that may have influenced mortality. However, this study is limited in that its retrospective comparison of listed to transplanted does not entirely eliminate selection bias. (For example, listed patients may have developed illnesses that ultimately prevented transplant and lead to death.) Additionally, the mortality benefits demonstrated in this study from the first half of the 1990s may not reflect those of current practice, given that prevention and treatment of ASCVD (a primary driver of mortality in ESRD) has improved markedly in the ensuing decades and may favor one group disproportionately.

As suggested by the authors at UpToDate, improved survival post-transplant may be due to the following factors: increased clearance of uremic toxins, reduction in inflammation and/or oxidative stress, reduced microvascular disease in diabetes mellitus, and improvement of LVH.

As a final note: in this modern era, it is surprising to see both a retrospective cohort study published in NEJM as well as the lack of preregistration of its analysis protocol prior to the study being conducted. Preregistration, even of interventional trials, did not become routine until the years following the announcement of the International Committee of Medical Journal Editors (ICMJE) trial registration policy in 2004 (Zarin et al.). Although, even today, retrospective cohort studies are not routinely preregistered, high profile journals increasingly require it because it helps differentiate between confirmatory versus exploratory research and reduce the appearance of post-hoc data dredging (i.e. p-hacking). Please see the Center for Open Science – Preregistration for further information. Here is another helpful discussion in PowerPoint form by Deborah A. Zarin, MD, Director of ClinicalTrials.gov.

Further Reading/References:
1. UpToDate, “Patient Survival After Renal Transplantation”
2. Zarin et al. “Update on Trial Registration 11 Years after the ICMJE Policy Was Established.” NEJM 2017

Summary by Duncan F. Moore, MD

Image Credit: Anna Frodesiak, CC0 1.0, via Wikimedia Commons

Week 26 – HACA

“Mild Therapeutic Hypothermia to Improve the Neurologic Outcome After Cardiac Arrest”

by the Hypothermia After Cardiac Arrest Study Group

N Engl J Med. 2002 Feb 21;346(8):549-56. [free full text]

Neurologic injury after cardiac arrest is a significant source of morbidity and mortality. It is hypothesized that brain reperfusion injury (via the generation of free radicals and other inflammatory mediators) following ischemic time is the primary pathophysiologic basis. Animal models and limited human studies have demonstrated that patients treated with mild hypothermia following cardiac arrest have improved neurologic outcome. The 2002 HACA study sought to evaluate prospectively the utility of therapeutic hypothermia in reducing neurologic sequelae and mortality post-arrest.

Population: European patients who achieve return of spontaneous circulation (ROSC) after presenting to the ED in cardiac arrest

inclusion criteria: witnessed arrest, ventricular fibrillation or non-perfusing ventricular tachycardia as initial rhythm, estimated interval 5 to 15 min from collapse to first resuscitation attempt, no more than 60 min from collapse to ROSC, age 18-75

pertinent exclusion: pt already < 30ºC on admission, comatose state prior to arrest d/t CNS drugs, response to commands following ROSC

Intervention: Cooling to target temperature 32-34ºC with maintenance for 24 hrs followed by passive rewarming. Pts received pancuronium for neuromuscular blockade to prevent shivering.

Comparison: Standard intensive care

Outcomes:
Primary: a “favorable neurologic outcome” at 6 months defined as Pittsburgh cerebral-performance scale category 1 (good recovery) or 2 (moderate disability). (Of note, the examiner was blinded to treatment group allocation.)

Secondary:

  • all-cause mortality at 6 months
  • specific complications within the first 7 days: bleeding “of any severity,” pneumonia, sepsis, pancreatitis, renal failure, pulmonary edema, seizures, arrhythmias, and pressure sores

Results:
3551 consecutive patients were assessed for enrollment and ultimately 275 met inclusion criteria and were randomized. The normothermia group had more baseline DM and CAD and were more likely to have received BLS from a bystander prior to the ED.

Regarding neurologic outcome at 6 months, 75 of 136 (55%) of the hypothermia group had a favorable neurologic outcome, versus 54/137 (39%) in the normothermia group (RR 1.40, 95% CI 1.08-1.81, p = 0.009; NNT = 6). After adjusting for all baseline characteristics, the RR increased slightly to 1.47 (95% CI 1.09-1.82).

Regarding death at 6 months, 41% of the hypothermia group had died, versus 55% of the normothermia group (RR 0.74, 95% CI 0.58-0.95, p = 0.02; NNT = 7). After adjusting for all baseline characteristics, RR = 0.62 (95% CI 0.36-0.95). There was no difference among the two groups in the rate of any complication or in the total number of complications during the first 7 days.

Implication/Discussion:
In ED patients with Vfib or pulseless VT arrest who did not have meaningful response to commands after ROSC, immediate therapeutic hypothermia reduced the rate of neurologic sequelae and mortality at 6 months.

Corresponding practice point from Dr. Sonti and Dr. Vinayak and their Georgetown Critical Care Top 40: “If after ROSC your patient remains unresponsive and does not have refractory hypoxemia/hypotension/coagulopathy, you should initiate therapeutic hypothermia even if the arrest was PEA. The benefit seen was substantial and any proposed biologic mechanism would seemingly apply to all causes of cardiac arrest. The investigators used pancuronium to prevent shivering; [at MGUH] there is a ‘shivering’ protocol in place and if refractory, paralytics can be used.”

This trial, as well as a concurrent publication by Benard et al. ushered in a new paradigm of therapeutic hypothermia or “targeted temperature management” (TTM) following cardiac arrest. Numerous trials in related populations and with modified interventions (e.g. target temperature 36º C) were performed over the following decade, and ultimately led to the current standard of practice.

Per UpToDate, the collective trial data suggest that “active control of the post-cardiac arrest patient’s core temperature, with a target between 32 and 36ºC, followed by active avoidance of fever, is the optimal strategy to promote patient survival.” TTM should be undertaken in all patients who do not follow commands or have purposeful movements following ROSC. Expert opinion at UpToDate recommends maintaining temperature control for at least 48 hours.

Further Reading/References:
1. HACA @ 2 Minute Medicine
2. HACA @ Wiki Journal Club
3. HACA @ Visualmed
4. Georgetown Critical Care Top 40, page 23 (Jan. 2016)
5. PulmCCM.org, “Hypothermia did not help after out-of-hospital cardiac arrest, in largest study yet”
6. Cochrane Review, “Hypothermia for neuroprotection in adults after cardiopulmonary resuscitation”
7. The NNT, “Mild Therapeutic Hypothermia for Neuroprotection Following CPR”
8. UpToDate, “Post-cardiac arrest management in adults”

Summary by Duncan F. Moore, MD

Week 24 – The Oregon Experiment

“The Oregon Experiment – Effects of Medicaid on Clinical Outcomes”

N Engl J Med. 2013 May 2;368(18):1713-22. [free full text]

Access to health insurance is not synonymous with access to healthcare. However, it has been generally assumed that increased access to insurance should improve healthcare outcomes among the newly insured. In 2008, Oregon expanded its Medicaid program by approximately 30,000 patients. These policies were lotteried among approximately 90,000 applicants. The authors of the Oregon Health Study Group sought to study the impact of this “randomized” intervention, and the results were hotly anticipated given the impending Medicaid expansion of the 2010 PPACA.

Population: Portland, Oregon residents who applied for the 2008 Medicaid expansion

Not all applicants were actually eligible.

Eligibility criteria: age 19-64, US citizen, Oregon resident, ineligible for other public insurance, uninsured for the previous 6 months, income below 100% of the federal poverty level, and assets < $2000.

Intervention: winning the Medicaid-expansion lottery

Comparison: The statistical analyses of clinical outcomes in this study do not actually compare winners to non-winners. Instead, they compare non-winners to winners who ultimately received Medicaid coverage. Winning the lottery increased the chance of being enrolled in Medicaid by about 25 percentage points. Given the assumption that “the lottery affected outcomes only by changing Medicaid enrollment, the effect of being enrolled in Medicaid was simply about 4 times…as high as the effect of being able to apply for Medicaid.” This allowed the authors to conclude causal inferences regarding the benefits of new Medicaid coverage.

Outcomes:
Values or point prevalence of the following at approximately 2 years post-lottery:
1. blood pressure, diagnosis of hypertension
2. cholesterol levels, diagnosis of hyperlipidemia
3. HgbA1c, diagnosis of diabetes
4. Framingham risk score for cardiovascular events
5. positive depression screen, depression dx after lottery, antidepressant use
6. health-related quality of life measures
7. measures of financial hardship (e.g. catastrophic expenditures)
8. measures of healthcare utilization (e.g. estimated total annual expenditure)

These outcomes were assessed via in-person interviews, assessment of blood pressure, and a blood draw for biomarkers.

Results:
The study population included 10,405 lottery winners and 10,340 non-winners. Interviews were performed ~25 months after the lottery. While there were no significant differences in baseline characteristics among winners and non-winners, “the subgroup of lottery winners who ultimately enrolled in Medicaid was not comparable to the overall group of persons who did not win the lottery” (no demographic or other data provided).

At approximately 2 years following the lottery, there were no differences in blood pressure or prevalence of diagnosed hypertension between the lottery non-winners and those who enrolled in Medicaid. There were also no differences between the groups in cholesterol values, prevalence of diagnosis of hypercholesterolemia after the lottery, or use of medications for high cholesterol. While more Medicaid enrollees were diagnosed with diabetes after the lottery (absolute increase of 3.8 percentage points, 95% CI 1.93-5.73, p<0.001; prevalence 1.1% in non-winners) and were more likely to be using medications for diabetes than the non-winners (absolute increase of 5.43 percentage points, 95% CI 1.39-9.48, p=0.008), there was no statistically significant difference in HgbA1c values among the two groups. Medicaid coverage did not significantly alter 10-year Framingham cardiovascular event risk. At follow-up, fewer Medicaid-enrolled patients screened positive for depression (decrease of 9.15 percentage points, 95% CI -16.70 to -1.60,  p=0.02), while more had formally been diagnosed with depression during the interval since the lottery (absolute increase of 3.81 percentage points, 95% CI 0.15-7.46, p=0.04). There was no significant difference in prevalence of antidepressant use.

Medicaid-enrolled patients were more likely to report that their health was the same or better since 1 year prior (increase of 7.84 percentage points, 95% CI 1.45-14.23, p=0.02). There were no significant differences in scores for quality of life related to physical health or in self-reported levels of pain or global happiness. As seen in Table 4, Medicaid enrollment was associated with decreased out-of-pocket spending (15% had a decrease, average decrease $215), decreased prevalence of medical debt, and a decreased prevalence of catastrophic expenditures (absolute decrease of 4.48 percentage points, 95% CI -8.26 to 0.69, p=0.02).

Medicaid-enrolled patients were prescribed more drugs and had more office visits but no change in number of ED visits or hospital admissions. Medicaid coverage was estimated to increase total annual medical spending by $1,172 per person (an approximately 35% increase). Of note, patients enrolled in Medicaid were more likely to have received a pap smear or mammogram during the study period.

Implication/Discussion:
This study was the first major study to “randomize” health insurance coverage and study the health outcome effects of gaining insurance.

Overall, this study demonstrated that obtaining Medicaid coverage “increased overall health care utilization, improved self-reported health, and reduced financial strain.” However, its effects on patient-level health outcomes were much more muted. Medicaid coverage did not impact the prevalence or severity of hypertension or hyperlipidemia. Medicaid coverage appeared to aid in the detection of diabetes mellitus and use of antihyperglycemics but did not affect average A1c. Accordingly, there was no significant difference in Framingham risk score among the two groups.

The glaring limitation of this study was that its statistical analyses compared two groups with unequal baseline characteristics, despite the purported “randomization” of the lottery. Effectively, by comparing Medicaid enrollees (and not all lottery winners) to the lottery non-winners, the authors failed to perform an intention-to-treat analysis. This design engendered significant confounding, and it is remarkable that the authors did not even attempt to report baseline characteristics among the final two groups, let alone control for any such differences in their final analyses. Furthermore, the fact that not all reported analyses were pre-specified raises suspicion of post hoc data dredging for statistically significant results (“p-hacking”). Overall, power was limited in this study due to the low prevalence of the conditions studied.

Contemporary analysis of this study, both within medicine and within the political sphere, was widely divergent. Medicaid-expansion proponents noted that new access to Medicaid provided a critical financial buffer from potentially catastrophic medical expenditures and allowed increased access to care (as measured by clinic visits, medication use, etc.), while detractors noted that, despite this costly program expansion and fine-toothed analysis, little hard-outcome benefit was realized during the (admittedly limited) follow-up at two years.

Access to insurance is only the starting point in improving the health of the poor. The authors note that “the effects of Medicaid coverage may be limited by the multiple sources of slippage…[including] access to care, diagnosis of underlying conditions, prescription of appropriate medications, compliance with recommendations, and effectiveness of treatment in improving health.”

Further Reading/References:
1. Baicker et al. (2013), “The Impact of Medicaid on Labor Force Activity and Program Participation: Evidence from the Oregon Health Insurance Experiment”
2. Taubman et al. (2014), “Medicaid Increases Emergency-Department Use: Evidence from Oregon’s Health Insurance Experiment”
3. The Washington Post, “Here’s what the Oregon Medicaid study really said” (2013)
4. Michael Cannon, “Oregon Study Throws a Stop Sign in Front of ObamaCare’s Medicaid Expansion”
5. HealthAffairs Policy Brief, “The Oregon Health Insurance Experiment”
6. The Oregon Health Insurance Experiment

Summary by Duncan F. Moore, MD

Image Credit: Centers for Medicare and Medicaid Services, Public Domain, via Wikimedia Commons

Week 22 – RALES

“The effect of spironolactone on morbidity and mortality in patients with severe heart failure”

by the Randomized Aldactone Evaluation Study Investigators

N Engl J Med. 1999 Sep 2;341(10):709-17. [free full text]

Inhibition of the renin-angiotensin-aldosterone system (RAAS) is a tenet of the treatment of heart failure with reduced ejection fraction (see post from Week 6 – SOLVD). However, physiologic evidence exists that suggests ACEis only partially inhibit aldosterone production. It had been hypothesized that aldosterone receptor blockade (e.g. with spironolactone) in conjunction with ACE inhibition could synergistically improve RAAS blockade; however, there was substantial clinician concern about the risk of hyperkalemia. In 1996, the RALES investigators demonstrated that the addition of spironolactone 12.5 or 25mg daily in combination with ACEi resulted in laboratory evidence of increased RAAS inhibition at 12 weeks with an acceptable increased risk of hyperkalemia. The 1999 RALES study was thus designed to evaluate prospectively the mortality benefit and safety of the addition of relatively low-dose aldosterone treatment to the standard HFrEF treatment regimen.

The study enrolled patients with severe HFrEF (LVEF ≤ 35% and NYHA class IV symptoms within the past 6 months and class III or IV symptoms at enrollment) currently being treated with an ACEi (if tolerated) and a loop diuretic. Patients were randomized to the addition of spironolactone 25mg PO daily or placebo. (The dose could be increased at 8 weeks to 50mg PO daily if the patient showed signs or symptoms of progression of CHF without evidence of hyperkalemia.) The primary outcome was all-cause mortality. Secondary outcomes included death from cardiac causes, hospitalization for cardiac causes, change in NYHA functional class, and incidence of hyperkalemia.

1663 patients were randomized. The trial was stopped early (mean follow-up of 24 months) due to the marked improvement in mortality among the spironolactone group. Among the placebo group, 386 (46%) patients died, whereas only 284 (35%) patients among the spironolactone group died (RR 0.70, 95% CI 0.60 to 0.82, p < 0.001; NNT = 8.8). See the dramatic Kaplan-Meier curve in Figure 1. Relative to placebo, spironolactone treatment reduced deaths secondary to cardiac causes by 31% and hospitalizations for cardiac causes by 30% (p < 0.001 for both). In placebo patients, NYHA class improved in 33% of cases, was unchanged in 18%, and worsened in 48% of patients; in spironolactone patients, the NYHA class improved in 41%, was unchanged in 21%, and worsened in 38% of patients (p < 0.001 for group difference by Wilcoxon test). “Serious hyperkalemia” occurred in 10 (1%) of placebo patients and 14 (2%) of spironolactone patients (p = 0.42). Treatment discontinuation rates were similar among the two groups.

Among patients with severe HFrEF, the addition of spironolactone improved mortality, reduced hospitalizations for cardiac causes, and improved symptoms without conferring an increased risk of serious hyperkalemia. The authors hypothesized that spironolactone “can prevent progressive heart failure by averting sodium retention and myocardial fibrosis” and can “prevent sudden death from cardiac causes by averting potassium loss and by increasing the myocardial uptake of norepinephrine.” Myocardial fibrosis is thought to be reduced via blocking the role aldosterone plays in collagen formation. Overall, this was a well-designed double-blind RCT that built upon the safety data of the safe-dose-finding 1996 RALES trial and ushered in the era of routine use of aldosterone receptor blockade in severe HFrEF. In 2003, the EPHESUS trial trial demonstrated a mortality benefit of aldosterone antagonism (with eplerenone) among patients with LV dysfunction following acute MI, and in 2011, the EMPHASIS-HF trial demonstrated a reduction in CV death or HF hospitalization with eplerenone use among patients with EF ≤ 35% and NYHA class II symptoms (and notably among patients with a much higher prevalence of beta-blocker use than those of the mid-1990s RALES cohort). The 2014 TOPCAT trial demonstrated that, among patients with HFpEF, spironolactone does not reduce a composite endpoint of CV mortality, aborted cardiac arrest, or HF hospitalizations.

The 2013 ACCF/AHA Guideline for the Management of Heart Failure recommends the use of aldosterone receptor antagonists in patients with NYHA class II-IV symptoms with LVEF ≤ 35% and following an acute MI in patients with LVEF ≤ 40% with symptomatic HF or with a history of diabetes mellitus. Contraindications include Cr ≥ 2.5 or K ≥ 5.0.

Further Reading/References:
1. “Effectiveness of spironolactone added to an angiotensin-converting enzyme inhibitor and a loop diuretic for severe chronic congestive heart failure (the Randomized Aldactone Evaluation Study [RALES]).” American Journal of Cardiology, 1996.
2. RALES @ Wiki Journal Club
3. RALES @ 2 Minute Medicine
4. EPHESUS @ Wiki Journal Club
5. EMPHASIS-HF @ Wiki Journal Club
6. TOPCAT @ Wiki Journal Club
7. 2013 ACCF/AHA Guideline for the Management of Heart Failure

Summary by Duncan F. Moore, MD

Image Credit: Spirono, CC0 1.0, via Wikimedia Commons

Week 21 – EINSTEIN-PE

“Oral Rivaroxaban for the Treatment of Symptomatic Pulmonary Embolism”

by the EINSTEIN-PE Investigators

N Engl J Med. 2012 Apr 5;366(14):1287-97. [free full text]

Prior to the introduction of DOACs, the standard of care for treatment of acute VTE was treatment with a vitamin K antagonist (VKA, e.g. warfarin) bridged with LMWH. In 2010, the EINSTEIN-DVT study demonstrated the non-inferiority of rivaroxaban (Xarelto) versus VKA with an enoxaparin bridge in patients with acute DVT in the prevention of recurrent VTE. Subsequently, in this 2012 study, EINSTEIN-PE, the EINSTEIN investigators examined the potential role for rivaroxaban in the treatment of acute PE.

This open-label RCT compared treatment of acute PE (± DVT) with rivaroxaban (15mg PO BID x21 days, followed by 20mg PO daily) versus VKA with an enoxaparin 1mg/kg bridge until the INR was therapeutic for 2+ days and the patient had received at least 5 days of enoxaparin. Patients with cancer were not excluded if they had a life expectancy of ≥ 3 months, but they comprised only ~4.5% of the patient population. Treatment duration was determined by the discretion of the treating physician and was decided prior to randomization. Duration was also a stratifying factor in the randomization. The primary outcome was symptomatic recurrent VTE (fatal or nonfatal). The pre-specified noninferiority margin was 2.0 for the upper limit of the 95% confidence interval of the hazard ratio. The primary safety outcome was “clinically relevant bleeding.”

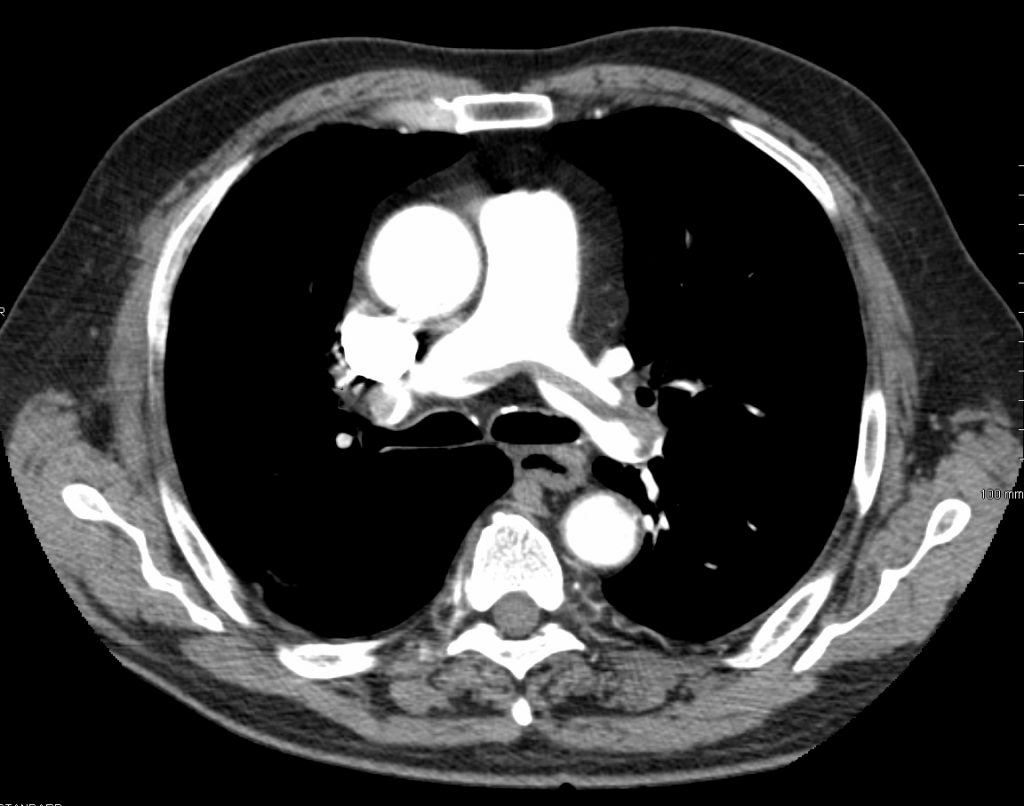
4833 patients were randomized. In the conventional-therapy group, the INR was in the therapeutic range 62.7% of the time. Symptomatic recurrent VTE occurred in 2.1% of patients in the rivaroxaban group and 1.8% of patients in the conventional-therapy group (HR 1.12, 95% CI 0.75–1.68, p = 0.003 for noninferiority). The p value for superiority of conventional therapy over rivaroxaban was 0.57. A first episode of “clinically relevant bleeding” occurred in 10.3% of the rivaroxaban group versus 11.4% of the conventional-therapy group (HR 0.90, 95% CI 0.76-1.07, p = 0.23).

In a large, open-label RCT, rivaroxaban was shown to be noninferior to standard therapy with a VKA + enoxaparin bridge in the treatment of acute PE. This was the first major RCT to demonstrate the safety and efficacy of a DOAC in the treatment of PE and led to FDA approval of rivaroxaban for the treatment of PE that same year. The following year, the AMPLIFY trial demonstrated that apixaban was noninferior to VKA + LMWH bridge in the prevention of recurrent VTE, and apixaban was also approved by the FDA for the treatment of PE. The 2016 Chest guidelines for Antithrombotic Therapy for VTE Disease recommend the DOACs rivaroxaban, apixaban, dabigatran, or edoxaban over VKA therapy in VTE not associated with cancer. In cancer-associated VTE, LMWH remains the recommended initial agent. (See the Week 10 – CLOT post.) As noted previously, a study earlier this year in NEJM demonstrated the noninferiority of edoxaban over LMWH in the treatment of cancer-associated VTE.

Further Reading/References:
1. EINSTEIN-DVT @ NEJM
2. EINSTEIN-PE @ Wiki Journal Club
3. EINSTEIN-PE @ 2 Minute Medicine
4. AMPLIFY @ Wiki Journal Club
5. “Edoxaban for the Treatment of Cancer-Associated Venous Thromboembolism” NEJM 2018

Summary by Duncan F. Moore, MD

Image Credit: James Heilman, MD / CC BY-SA 4.0 / via WikiMedia Commons

Week 20 – Omeprazole for Bleeding Peptic Ulcers

“Effect of Intravenous Omeprazole on Recurrent Bleeding After Endoscopic Treatment of Bleeding Peptic Ulcers”

N Engl J Med. 2000 Aug 3;343(5):310-6. [free full text]

Intravenous proton-pump inhibitor (PPI) therapy is a cornerstone of modern therapy for bleeding peptic ulcers. However, prior to this 2000 study by Lau et al., the role of PPIs in the prevention of recurrent bleeding after endoscopic treatment was unclear. At the time, re-bleeding rates after endoscopic treatment were noted to be approximately 15-20%. Although other studies had approached this question, no high-quality, large, blinded RCT had examined adjuvant PPI use immediately following endoscopic treatment.

The study enrolled patients who had a bleeding gastroduodenal ulcer visualized on endoscopy and in whom hemostasis was achieved following epinephrine injection and thermocoagulation. Enrollees were randomized to treatment with either omeprazole 80mg IV bolus followed by 8mg/hr infusion x72 hours then followed by omeprazole 20mg PO x8 weeks or to placebo bolus + drip x72 hours followed by omeprazole 20mg PO x8 weeks. The primary outcome was recurrent bleeding within 30 days. Secondary outcomes included recurrent bleeding within 72 hours, amount of blood transfused by day 30, hospitalization duration, and all-cause 30-day mortality.

120 patients were randomized to each arm. The trial was terminated early due to the finding on interim analysis of a significantly lower recurrent bleeding rate in the omeprazole arm. Bleeding re-occurred within 30 days in 8 (6.7%) omeprazole patients versus 27 (22.5%) placebo patients (HR 3.9, 95% CI 1.7-9.0; NNT 6.3). A Cox proportional-hazards model, when adjusted for size and location of ulcers, presence/absence of coexisting illness, and history of ulcer disease, revealed a similar hazard ratio (HR 3.9, 95% CI 1.7-9.1). Recurrent bleeding was most common during the first 72 hrs (4.2% of the omeprazole group versus 20% of the placebo group, RR 4.80, 95% CI 1.89-12.2, p<0.001). For a nice visualization of the early separation of re-bleeding rates, see the Kaplan-Meier curve in Figure 1. The mean number of units of blood transfused within 30 days was 2.7 ± 2.5 in the omeprazole group versus 3.5 ± 3.8 in the placebo group (p = 0.04). Regarding duration of hospitalization, 46.7% of omeprazole patients were admitted for < 5 days versus 31.7% of placebo patients (p = 0.02). Median stay was 4 days in the omeprazole group versus 5 days in the placebo group (p = 0.006). 4.2% of the omeprazole patients died within 30 days, whereas 10% of the placebo patients died (p = 0.13).

Treatment with intravenous omeprazole immediately following endoscopic intervention for bleeding peptic ulcer significantly reduced the rate of recurrent bleeding. This effect was most prominent within the first 3 days of therapy. This intervention also reduced blood transfusion requirements and shortened hospital stays. The presumed mechanism of action is increased gastric pH facilitating platelet aggregation. In 2018, the benefit of this intervention seems so obvious based on its description alone that one would not imagine that such a trial would be funded or published in such a high-profile journal. However, the annals of medicine are littered with now-discarded interventions that made sense from a theoretical or mechanistic perspective but were demonstrated to be ineffective or even harmful (e.g. pharmacologic suppression of ventricular arrhythmias post-MI or renal denervation for refractory HTN).

Today, bleeding peptic ulcers are treated with an IV PPI twice daily. Per UpToDate, meta-analyses have not shown a benefit of continuous PPI infusion over this IV BID dosing. However, per 2012 guidelines in the American Journal of Gastroenterology, patients with active bleeding or non-bleeding visible vessels should receive both endoscopic intervention and IV PPI bolus followed by infusion.

Further Reading/References:
1. Wiki Journal Club
2. 2 Minute Medicine
3. UpToDate, “Overview of the Treatment of Bleeding Peptic Ulcers”
4. Laine L, Jensen DM. “Management of patients with ulcer bleeding.” Am J Gastroenterol. 2012

Summary by Duncan F. Moore, MD

Image credit: Wesalius, CC BY 4.0, via Wikimedia Commons

Week 19 – COPERNICUS

“Effect of carvedilol on survival in severe chronic heart failure”

by the Carvedilol Prospective Randomized Cumulative Survival (COPERNICUS) Study Group

N Engl J Med. 2001 May 31;344(22):1651-8. [free full text]

We are all familiar with the role of beta-blockers in the management of heart failure with reduced ejection fraction. In the late 1990s, a growing body of excellent RCTs demonstrated that metoprolol succinate, bisoprolol, and carvedilol improved morbidity and mortality in patients with mild to moderate HFrEF. However, the only trial of beta-blockade (with bucindolol) in patients with severe HFrEF failed to demonstrate a mortality benefit. In 2001, the COPERNICUS trial further elucidated the mortality benefit of carvedilol in patients with severe HFrEF.

The study enrolled patients with severe CHF (NYHA class III-IV symptoms and LVEF < 25%) despite “appropriate conventional therapy” and randomized them to treatment with carvedilol with protocolized uptitration (in addition to pt’s usual meds) or placebo with protocolized uptitration (in addition to pt’s usual meds). The major outcomes measured were all-cause mortality and the combined risk of death or hospitalization for any cause.

2289 patients were randomized before the trial was stopped early due to higher than expected survival benefit in the carvedilol arm. Mean follow-up was 10.4 months. Regarding mortality, 190 (16.8%) of placebo patients died, while only 130 (11.2%) of carvedilol patients died (p = 0.0014) (NNT = 17.9). Regarding mortality or hospitalization, 507 (44.7%) of placebo patients died or were hospitalized, but only 425 (36.8%) of carvedilol patients died or were hospitalized (NNT = 12.6). Both outcomes were found to be of similar directions and magnitudes in subgroup analyses (age, sex, LVEF < 20% or >20%, ischemic vs. non-ischemic CHF, study site location, and no CHF hospitalization within year preceding randomization).

Implication/Discussion:
In severe HFrEF, carvedilol significantly reduces mortality and hospitalization risk.

This was a straightforward, well-designed, double-blind RCT with a compelling conclusion. In addition, the dropout rate was higher in the placebo arm than the carvedilol arm! Despite longstanding clinician fears that beta-blockade would be ineffective or even harmful in patients with already advanced (but compensated) HFrEF, this trial definitively established the role for beta-blockade in such patients.

Per the 2013 ACCF/AHA guidelines, “use of one of the three beta blockers proven to reduce mortality (e.g. bisoprolol, carvedilol, and sustained-release metoprolol succinate) is recommended for all patients with current or prior symptoms of HFrEF, unless contraindicated.”

Please note that there are two COPERNICUS trials. This is the first reported study (NEJM 2001) which reports only the mortality and mortality + hospitalization results, again in the context of a highly anticipated trial that was terminated early due to mortality benefit. A year later, the full results were published in Circulation, which described findings such as a decreased number of hospitalizations, fewer total hospitalization days, fewer days hospitalized for CHF, improved subjective scores, and fewer serious adverse events (e.g. sudden death, cardiogenic shock, VT) in the carvedilol arm.

Further Reading/References:
1. 2013 ACCF/AHA Guideline for the Management of Heart Failure
2. 2017 ACC/AHA/HFSA Focused Update of the 2013 ACCF/AHA Guideline for the Management of Heart Failure
3. COPERNICUS, 2002 Circulation version
4. Wiki Journal Club (describes 2001 NEJM, cites 2002 Circulation)
5. 2 Minute Medicine (describes and cites 2002 Circulation)

Summary by Duncan F. Moore, MD

Week 18 – Early Palliative Care in NSCLC

“Early Palliative Care for Patients with Metastatic Non-Small-Cell Lung Cancer”

N Engl J Med. 2010 Aug 19;363(8):733-42 [free full text]

Ideally, palliative care improves a patient’s quality of life while facilitating appropriate usage of healthcare resources. However, initiating palliative care late in a disease course or in the inpatient setting may limit these beneficial effects. This 2010 study by Temel et al. sought to demonstrate benefits of early integrated palliative care on patient-reported quality-of-life (QoL) outcomes and resource utilization.

The study enrolled outpatients with metastatic NSCLC diagnosed < 8 weeks ago and ECOG performance status 0-2 and randomized them to either “early palliative care” (met with palliative MD/ARNP within 3 weeks of enrollment and at least monthly afterward) or to standard oncologic care. The primary outcome was the change in Trial Outcome Index (TOI) from baseline to 12 weeks.

TOI = sum of the lung cancer, physical well-being, and functional well-being subscales of the Functional Assessment of Cancer Therapy­–Lung (FACT-L) scale (scale range 0-84, higher score = better function)

Secondary outcomes included:

  1. change in FACT-L score at 12 weeks (scale range 0-136)
  2. change in lung cancer subscale of FACT-L at 12 weeks (scale range 0-28)
  3. “aggressive care,” meaning one of the following: chemo within 14 days before death, lack of hospice care, or admission to hospice ≤ 3 days before death
  4. documentation of resuscitation preference in outpatient records
  5. prevalence of depression at 12 weeks per HADS and PHQ-9
  6. median survival

151 patients were randomized. Palliative-care patients (n=77) had a mean TOI increase of 2.3 points vs. a 2.3-point decrease in the standard-care group (n=73) (p=0.04). Median survival was 11.6 months in the palliative group vs. 8.9 months in the standard group (p=0.02). (See Figure 3 on page 741 for the Kaplan-Meier curve.) Prevalence of depression at 12 weeks per PHQ-9 was 4% in palliative patients vs. 17% in standard patients (p = 0.04). Aggressive end-of-life care was received in 33% of palliative patients vs. 53% of standard patients (p=0.05). Resuscitation preferences were documented in 53% of palliative patients vs. 28% of standard patients (p=0.05). There was no significant change in FACT-L score or lung cancer subscale score at 12 weeks.

Implication/Discussion:
Early palliative care in patients with metastatic non-small cell lung cancer improved quality of life and mood, decreased aggressive end-of-life care, and improved survival. This is a landmark study, both for its quantification of the QoL benefits of palliative intervention and for its seemingly counterintuitive finding that early palliative care actually improved survival.

The authors hypothesized that the demonstrated QoL and mood improvements may have led to the increased survival, as prior studies had associated lower QoL and depressed mood with decreased survival. However, I find more compelling their hypotheses that “the integration of palliative care with standard oncologic care may facilitate the optimal and appropriate administration of anticancer therapy, especially during the final months of life” and earlier referral to a hospice program may result in “better management of symptoms, leading to stabilization of [the patient’s] condition and prolonged survival.”

In practice, this study and those that followed have further spurred the integration of palliative care into many standard outpatient oncology workflows, including features such as co-located palliative care teams and palliative-focused checklists/algorithms for primary oncology providers. Of note, in the inpatient setting, a recent meta-analysis concluded that early hospital palliative care consultation was associated with a $3200 reduction in direct hospital costs ($4250 in subgroup of patients with cancer).

Further Reading/References:
1. ClinicalTrials.gov
2. Wiki Journal Club
3. Profile of first author Dr. Temel
4. “Economics of Palliative Care for Hospitalized Adults with Serious Illness: A Meta-analysis” JAMA Internal Medicine (2018)
5. UpToDate, “Benefits, services, and models of subspecialty palliative care”

Summary by Duncan F. Moore, MD

Week 17 – 4S

“Randomised trial of cholesterol lowering in 4444 patients with coronary heart disease: the Scandinavian Simvastatin Survival Study (4S)”

Lancet. 1994 Nov 19;344(8934):1383-9 [free full text]

Statins are an integral part of modern primary and secondary prevention of atherosclerotic cardiovascular disease (ASCVD). Hypercholesterolemia is regarded as a major contributory factor to the development of atherosclerosis, and in the 1980s, a handful of clinical trials demonstrated reduction in MI/CAD incidence with cholesterol-lowering agents, such as cholestyramine and gemfibrozil. However, neither drug demonstrated a mortality benefit. By the late 1980s, there was much hope that the emerging drug class of HMG-CoA reductase inhibitors (statins) would confer a mortality benefit, given their previously demonstrated LDL-lowering effects. The 1994 Scandinavian Simvastatin Survival Study was the first large clinical trial to assess this hypothesis.

4444 adults ages 35-70 with a history of angina pectoris or MI and elevated serum total cholesterol (212 – 309 mg/dL) were recruited from 94 clinical centers in Scandinavia (and in Finland, which is technically a Nordic country but not a Scandinavian country…) and randomized to treatment with either simvastatin 20mg PO qPM or placebo. Dosage was increased at 12 weeks and 6 months to target a serum total cholesterol of 124 to 201 mg/dL. (Placebo patients were randomly uptitrated as well.) The primary endpoint was all-cause mortality. The secondary endpoint was time to first “major coronary event,” which included coronary deaths, nonfatal MI, resuscitated cardiac arrest, and definite silent MI per EKG.

The study was stopped early in 1994 after an interim analysis demonstrated a significant survival benefit in the treatment arm. At a mean 5.4 years of follow-up, 256 (12%) in the placebo group versus 182 (8%) in the simvastatin group had died (RR 0.70, 95% CI 0.58-0.85, p=0.0003, NNT = 30.1). The mortality benefit was driven exclusively by a reduction in coronary deaths. Dropout rates were similar (13% of placebo group and 10% of simvastatin group). The secondary endpoint, occurrence of a major coronary event, occurred in 622 (28%) of the placebo group and 431 (19%) of the simvastatin group (RR 0.66, 95% CI 0.59-0.75, p < 0.00001). Subgroup analyses of women and patients aged 60+ demonstrated similar findings for the primary and secondary outcomes. Over the entire course of the study, the average changes in lipid values from baseline in the simvastatin group were -25% total cholesterol, -35% LDL, +8% HDL, and -10% triglycerides. The corresponding percent changes from baseline in the placebo group were +1%, +1%, +1%, and +7%, respectively.

In conclusion, simvastatin therapy reduced mortality in patients with known CAD and hypercholesterolemia via reduction of major coronary events. This was a large, well-designed, double-blind RCT that ushered in the era of widespread statin use for secondary, and eventually, primary prevention of ASCVD. For further information about modern guidelines for the use of statins, please see the 2013 “ACC/AHA Guideline on the Treatment of Blood Cholesterol to Reduce Atherosclerotic Cardiovascular Risk in Adults” and the 2016 USPSTF guideline “Statin use for the Primary Prevention of Cardiovascular Disease in Adults: Preventive Medication”.

Finally, for history buffs interested in a brief history of the discovery and development of this drug class, please see this paper by Akira Endo.

References / Additional Reading:
1. 4S @ Wiki JournalClub
2. “2013 ACC/AHA Guideline on the Treatment of Blood Cholesterol to Reduce Atherosclerotic Cardiovascular Risk in Adults”
3. “Statin use for the Primary Prevention of Cardiovascular Disease in Adults: Preventive Medication” (2016)
4. UpToDate, “Society guideline links: Lipid disorders in adults”
5. “A historical perspective on the discovery of statins” (2010)

Summary by Duncan F. Moore, MD

Image Credit: Siol, CC BY-SA 3.0, via Wikimedia Commons

Week 16 – MELD

“A Model to Predict Survival in Patients With End-Stage Liver Disease”

Hepatology. 2001 Feb;33(2):464-70. [free full text]

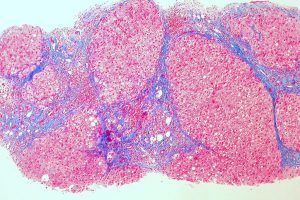
Prior to the adoption of the Model for End-Stage Liver Disease (MELD) score for the allocation of liver transplants, the determination of medical urgency was dependent on the Child-Pugh score. The Child-Pugh score was limited by the inclusion of two subjective variables (severity of ascites and severity of encephalopathy), limited discriminatory ability, and a ceiling effect of laboratory abnormalities. Stakeholders sought an objective, continuous, generalizable index that more accurately and reliably represented disease severity. The MELD score had originally been developed in 2000 to estimate the survival of patients undergoing TIPS. The authors of this 2001 study hypothesized that the MELD score would accurately estimate short-term survival in a wide range of severities and etiologies of liver dysfunction and thus serve as a suitable replacement measure for the Child-Pugh score in the determination of medical urgency in transplant allocation.

This study reported a series of four retrospective validation cohorts for the use of MELD in prediction of mortality in advanced liver disease. The index MELD score was calculated for each patient. Death during follow-up was assessed by chart review.

MELD score = 3.8*ln([bilirubin])+11.2*ln(INR)+9.6*ln([Cr])+6.4*(etiology: 0 if cholestatic or alcoholic, 1 otherwise)

The primary study outcome was the concordance c-statistic between MELD score and 3-month survival. The c-statistic is equivalent to the area under receiver operating characteristic (AUROC). Per the authors, “a c-statistic between 0.8 and 0.9 indicates excellent diagnostic accuracy and a c-statistic greater than 0.7 is generally considered as a useful test.” (See page 455 for further explanation.) There was no reliable comparison statistic (e.g. c-statistic of MELD vs. that of Child-Pugh in all groups).

C-statistic for 3-month survival in the four cohorts ranged from 0.78 to 0.87 (no 95% CIs exceeded 1.0). There was minimal improvement in the c-statistics for 3-month survival with the individual addition of spontaneous bacterial peritonitis, variceal bleed, ascites, and encephalopathy to the MELD score (see Table 4, highest increase in c-statistic was 0.03). When the etiology of liver disease was excluded from the MELD score, there was minimal change in the c-statistics (see Table 5, all paired CIs overlap). C-statistics for 1-week mortality ranged from 0.80 to 0.95.

In conclusion, the MELD score is an excellent predictor of short-term mortality in patients with end-stage liver disease of diverse etiology and severity. Despite the retrospective nature of this study, this study represented a significant improvement upon the Child-Pugh score in determining medical urgency in patients who require liver transplant. In 2002, the United Network for Organ Sharing (UNOS) adopted a modified version of the MELD score for the prioritization of deceased-donor liver transplants in cirrhosis. Concurrent with the 2001 publication of this study, Wiesner et al. performed a prospective validation of the use of MELD in the allocation of liver transplantation. When published in 2003, it demonstrated that MELD score accurately predicted 3-month mortality among patients with chronic liver disease on the waitlist. The MELD score has also been validated in other conditions such as alcoholic hepatitis, hepatorenal syndrome, and acute liver failure (see UpToDate). Subsequent additions to the MELD score have come out over the years. In 2006, the MELD Exception Guidelines offered extra points for severe comorbidities (e.g HCC, hepatopulmonary syndrome). In January 2016, the MELDNa score was adopted and is now used for liver transplant prioritization.

References and Further Reading:
1. “A model to predict poor survival in patients undergoing transjugular intrahepatic portosystemic shunts” (2000)
2. MDCalc “MELD Score”
3. Wiesner et al. “Model for end-stage liver disease (MELD) and allocation of donor livers” (2003)
4. Freeman Jr. et al. “MELD exception guidelines” (2006)
5. 2 Minute Medicine
6. UpToDate “Model for End-stage Liver Disease (MELD)”

Image Credit: Ed Uthman, CC-BY-2.0, via WikiMedia Commons