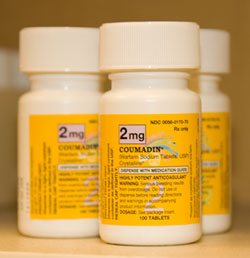
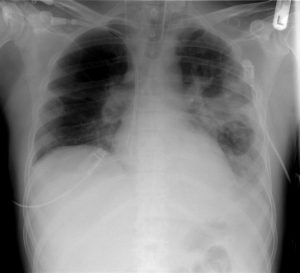
Week 17 – 4S

“Randomised trial of cholesterol lowering in 4444 patients with coronary heart disease: the Scandinavian Simvastatin Survival Study (4S)”

Lancet. 1994 Nov 19;344(8934):1383-9 [free full text]

Statins are an integral part of modern primary and secondary prevention of atherosclerotic cardiovascular disease (ASCVD). Hypercholesterolemia is regarded as a major contributory factor to the development of atherosclerosis, and in the 1980s, a handful of clinical trials demonstrated reduction in MI/CAD incidence with cholesterol-lowering agents, such as cholestyramine and gemfibrozil. However, neither drug demonstrated a mortality benefit. By the late 1980s, there was much hope that the emerging drug class of HMG-CoA reductase inhibitors (statins) would confer a mortality benefit, given their previously demonstrated LDL-lowering effects. The 1994 Scandinavian Simvastatin Survival Study was the first large clinical trial to assess this hypothesis.

4444 adults ages 35-70 with a history of angina pectoris or MI and elevated serum total cholesterol (212 – 309 mg/dL) were recruited from 94 clinical centers in Scandinavia (and in Finland, which is technically a Nordic country but not a Scandinavian country…) and randomized to treatment with either simvastatin 20mg PO qPM or placebo. Dosage was increased at 12 weeks and 6 months to target a serum total cholesterol of 124 to 201 mg/dL. (Placebo patients were randomly uptitrated as well.) The primary endpoint was all-cause mortality. The secondary endpoint was time to first “major coronary event,” which included coronary deaths, nonfatal MI, resuscitated cardiac arrest, and definite silent MI per EKG.

The study was stopped early in 1994 after an interim analysis demonstrated a significant survival benefit in the treatment arm. At a mean 5.4 years of follow-up, 256 (12%) in the placebo group versus 182 (8%) in the simvastatin group had died (RR 0.70, 95% CI 0.58-0.85, p=0.0003, NNT = 30.1). The mortality benefit was driven exclusively by a reduction in coronary deaths. Dropout rates were similar (13% of placebo group and 10% of simvastatin group). The secondary endpoint, occurrence of a major coronary event, occurred in 622 (28%) of the placebo group and 431 (19%) of the simvastatin group (RR 0.66, 95% CI 0.59-0.75, p < 0.00001). Subgroup analyses of women and patients aged 60+ demonstrated similar findings for the primary and secondary outcomes. Over the entire course of the study, the average changes in lipid values from baseline in the simvastatin group were -25% total cholesterol, -35% LDL, +8% HDL, and -10% triglycerides. The corresponding percent changes from baseline in the placebo group were +1%, +1%, +1%, and +7%, respectively.

In conclusion, simvastatin therapy reduced mortality in patients with known CAD and hypercholesterolemia via reduction of major coronary events. This was a large, well-designed, double-blind RCT that ushered in the era of widespread statin use for secondary, and eventually, primary prevention of ASCVD. For further information about modern guidelines for the use of statins, please see the 2013 “ACC/AHA Guideline on the Treatment of Blood Cholesterol to Reduce Atherosclerotic Cardiovascular Risk in Adults” and the 2016 USPSTF guideline “Statin use for the Primary Prevention of Cardiovascular Disease in Adults: Preventive Medication”.

Finally, for history buffs interested in a brief history of the discovery and development of this drug class, please see this paper by Akira Endo.

References / Additional Reading:
1. 4S @ Wiki JournalClub
2. “2013 ACC/AHA Guideline on the Treatment of Blood Cholesterol to Reduce Atherosclerotic Cardiovascular Risk in Adults”
3. “Statin use for the Primary Prevention of Cardiovascular Disease in Adults: Preventive Medication” (2016)
4. UpToDate, “Society guideline links: Lipid disorders in adults”
5. “A historical perspective on the discovery of statins” (2010)

Summary by Duncan F. Moore, MD

Image Credit: Siol, CC BY-SA 3.0, via Wikimedia Commons
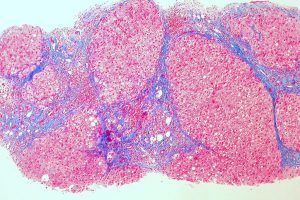
Week 16 – MELD

“A Model to Predict Survival in Patients With End-Stage Liver Disease”

Hepatology. 2001 Feb;33(2):464-70. [free full text]

Prior to the adoption of the Model for End-Stage Liver Disease (MELD) score for the allocation of liver transplants, the determination of medical urgency was dependent on the Child-Pugh score. The Child-Pugh score was limited by the inclusion of two subjective variables (severity of ascites and severity of encephalopathy), limited discriminatory ability, and a ceiling effect of laboratory abnormalities. Stakeholders sought an objective, continuous, generalizable index that more accurately and reliably represented disease severity. The MELD score had originally been developed in 2000 to estimate the survival of patients undergoing TIPS. The authors of this 2001 study hypothesized that the MELD score would accurately estimate short-term survival in a wide range of severities and etiologies of liver dysfunction and thus serve as a suitable replacement measure for the Child-Pugh score in the determination of medical urgency in transplant allocation.

This study reported a series of four retrospective validation cohorts for the use of MELD in prediction of mortality in advanced liver disease. The index MELD score was calculated for each patient. Death during follow-up was assessed by chart review.

MELD score = 3.8*ln([bilirubin])+11.2*ln(INR)+9.6*ln([Cr])+6.4*(etiology: 0 if cholestatic or alcoholic, 1 otherwise)

The primary study outcome was the concordance c-statistic between MELD score and 3-month survival. The c-statistic is equivalent to the area under receiver operating characteristic (AUROC). Per the authors, “a c-statistic between 0.8 and 0.9 indicates excellent diagnostic accuracy and a c-statistic greater than 0.7 is generally considered as a useful test.” (See page 455 for further explanation.) There was no reliable comparison statistic (e.g. c-statistic of MELD vs. that of Child-Pugh in all groups).

C-statistic for 3-month survival in the four cohorts ranged from 0.78 to 0.87 (no 95% CIs exceeded 1.0). There was minimal improvement in the c-statistics for 3-month survival with the individual addition of spontaneous bacterial peritonitis, variceal bleed, ascites, and encephalopathy to the MELD score (see Table 4, highest increase in c-statistic was 0.03). When the etiology of liver disease was excluded from the MELD score, there was minimal change in the c-statistics (see Table 5, all paired CIs overlap). C-statistics for 1-week mortality ranged from 0.80 to 0.95.

In conclusion, the MELD score is an excellent predictor of short-term mortality in patients with end-stage liver disease of diverse etiology and severity. Despite the retrospective nature of this study, this study represented a significant improvement upon the Child-Pugh score in determining medical urgency in patients who require liver transplant. In 2002, the United Network for Organ Sharing (UNOS) adopted a modified version of the MELD score for the prioritization of deceased-donor liver transplants in cirrhosis. Concurrent with the 2001 publication of this study, Wiesner et al. performed a prospective validation of the use of MELD in the allocation of liver transplantation. When published in 2003, it demonstrated that MELD score accurately predicted 3-month mortality among patients with chronic liver disease on the waitlist. The MELD score has also been validated in other conditions such as alcoholic hepatitis, hepatorenal syndrome, and acute liver failure (see UpToDate). Subsequent additions to the MELD score have come out over the years. In 2006, the MELD Exception Guidelines offered extra points for severe comorbidities (e.g HCC, hepatopulmonary syndrome). In January 2016, the MELDNa score was adopted and is now used for liver transplant prioritization.

References and Further Reading:
1. “A model to predict poor survival in patients undergoing transjugular intrahepatic portosystemic shunts” (2000)
2. MDCalc “MELD Score”
3. Wiesner et al. “Model for end-stage liver disease (MELD) and allocation of donor livers” (2003)
4. Freeman Jr. et al. “MELD exception guidelines” (2006)
5. 2 Minute Medicine
6. UpToDate “Model for End-stage Liver Disease (MELD)”

Image Credit: Ed Uthman, CC-BY-2.0, via WikiMedia Commons

Week 15 – CHADS2

“Validation of Clinical Classification Schemes for Predicting Stroke”

JAMA. 2001 June 13;285(22):2864-70. [free full text]

Atrial fibrillation is the most common cardiac arrhythmia and affects 1-2% of the overall population with increasing prevalence as people age. Atrial fibrillation also carries substantial morbidity and mortality due to the risk of stroke and thromboembolism although the risk of embolic phenomenon varies widely across various subpopulations. In 2001, the only oral anticoagulation options available were warfarin and aspirin, which had relative risk reductions of 62% and 22%, respectively, consistent across these subpopulations. Clinicians felt that high risk patients should be anticoagulated, but the two common classification schemes, AFI and SPAF, were flawed. Patients were often classified as low risk in one scheme and high risk in the other. The schemes were derived retrospectively and were clinically ambiguous. Therefore, in 2001, a group of investigators combined the two existing schemes to create the CHADS2 scheme and applied it to a new data set.

Population (NRAF cohort): Hospitalized Medicare patients ages 65-95 with non-valvular AF not prescribed warfarin at hospital discharge.

Intervention: Determination of CHADS2 score (1 point for recent CHF, hypertension, age ≥ 75, and DM; 2 points for a history of stroke or TIA)

Comparison: AFI and SPAF risk schemes

Measured Outcome: Hospitalization rates for ischemic stroke (per ICD-9 codes from Medicare claims), stratified by CHADS2 / AFI / SPAF scores.

Calculated Outcome: performance of the various schemes, based on c statistic (a measure of predictive accuracy in a binary logistic regression model)

Results:
1733 patients were identified in the NRAF cohort. When compared to the AFI and SPAF trials, these patients tended be older (81 in NRAF vs. 69 in AFI vs. 69 in SPAF), have a higher burden of CHF (56% vs. 22% vs. 21%), are more likely to be female (58% vs. 34% vs. 28%), and have a history of DM (23% vs. 15% vs. 15%) or prior stroke/TIA (25% vs. 17% vs. 8%). The stroke rate was lowest in the group with a CHADS2 = 0 (1.9 per 100 patient years, adjusting for the assumption that aspirin was not taken). The stroke rate increased by a factor of approximately 1.5 for each 1-point increase in the CHADS2 score.

CHADS2 score           NRAF Adjusted Stroke Rate per 100 Patient-Years
0                                      1.9
1                                      2.8
2                                      4.0
3                                      5.9
4                                      8.5
5                                      12.5
6                                      18.2

The CHADS2 scheme had a c statistic of 0.82 compared to 0.68 for the AFI scheme and 0.74 for the SPAF scheme.

Implication/Discussion
The CHADS2 scheme provides clinicians with a scoring system to help guide decision making for anticoagulation in patients with non-valvular AF.

The authors note that the application of the CHADS2 score could be useful in several clinical scenarios. First, it easily identifies patients at low risk of stroke (CHADS2 = 0) for whom anticoagulation with warfarin would probably not provide significant benefit. The authors argue that these patients should merely be offered aspirin. Second, the CHADS2 score could facilitate medication selection based on a patient-specific risk of stroke. Third, the CHADS2 score could help clinicians make decisions regarding anticoagulation in the perioperative setting by evaluating the risk of stroke against the hemorrhagic risk of the procedure. Although the CHADS2 is no longer the preferred risk-stratification scheme, the same concepts are still applicable to the more commonly used CHA2DS2-VASc.

This study had several strengths. First, the cohort was from seven states that represented all geographic regions of the United States. Second, CHADS2 was pre-specified based on previous studies and validated using the NRAF data set. Third, the NRAF data set was obtained from actual patient chart review as opposed to purely from an administrative database. Finally, the NRAF patients were older and sicker than those of the AFI and SPAF cohorts, and thus the CHADS2 appears to be generalizable to the very large demographic of frail, elderly Medicare patients.

As CHADS2 became widely used clinically in the early 2000s, its application to other cohorts generated a large intermediate-risk group (CHADS2 = 1), which was sometimes > 60% of the cohort (though in the NRAF cohort, CHADS2 = 1 accounted for 27% of the cohort). In clinical practice, this intermediate-risk group was to be offered either warfarin or aspirin. Clearly, a clinical-risk predictor that does not provide clear guidance in over 50% of patients needs to be improved. As a result, the CHA2DS2-VASc scoring system was developed from the Birmingham 2009 scheme. When compared head-to-head in registry data, CHA2DS2-VASc more effectively discriminated stroke risk among patients with a baseline CHADS2 score of 0 to 1. Because of this, CHA2DS2-VASc is the recommended risk stratification scheme in the AHA/ACC/HRS 2014 Practice Guideline for Atrial Fibrillation. In modern practice, anticoagulation is unnecessary when CHA2DS2-VASc score = 0, should be considered (vs. antiplatelet or no treatment) when score = 1, and is recommended when score ≥ 2.

Further Reading:
1. AHA/ACC/HRS 2014 Practice Guideline for Atrial Fibrillation
2. CHA2DS2-VASc (2010)
3. 2 Minute Medicine

Summary by Ryan Commins, MD

Image Credit: Alisa Machalek, NIGMS/NIH – National Insititue of General Medical Sciences, Public Domain

Week 14 – CURB-65

“Defining community acquired pneumonia severity on presentation to hospital: an international derivation and validation study”

Thorax. 2003 May;58(5):377-82. [free full text]

Community-acquired pneumonia (CAP) is frequently encountered by the admitting medicine team. Ideally, the patient’s severity at presentation and risk for further decompensation should determine the appropriate setting for further care, whether as an outpatient, on an inpatient ward, or in the ICU. At the time of this 2003 study, the predominant decision aid was the 20-variable Pneumonia Severity Index. The authors of this study sought to develop a simpler decision aid for determining the appropriate level of care at presentation.

The study examined the 30-day mortality rates of adults admitted for CAP via the ED at three non-US academic medical centers (data from three previous CAP cohort studies). 80% of the dataset was analyzed as a derivation cohort – meaning it was used to identify statistically significant, clinically relevant prognostic factors that allowed for mortality risk stratification. The resulting model was applied to the remaining 20% of the dataset (the validation cohort) in order to assess the accuracy of its predictive ability.

The following variables were integrated into the final model (CURB-65):

  1. Confusion
  2. Urea > 19mg/dL (7 mmol/L)
  3. Respiratory rate ≥ 30 breaths/min
  4. low Blood pressure (systolic BP < 90 mmHg or diastolic BP < 60 mmHg)
  5. age ≥ 65

1068 patients were analyzed. 821 (77%) were in the derivation cohort. 86% of patients received IV antibiotics, 5% were admitted to the ICU, and 4% were intubated. 30-day mortality was 9%. 9 of 11 clinical features examined in univariate analysis were statistically significant (see Table 2).

Ultimately, using the above-described CURB-65 model, in which 1 point is assigned for each clinical characteristic, patients with a CURB-65 score of 0 or 1 had 1.5% mortality, patients with a score of 2 had 9.2% mortality, and patients with a score of 3 or more had 22% mortality. Similar values were demonstrated in the validation cohort. Table 5 summarizes the sensitivity, specificity, PPVs, and NPVs of each CURB-65 score for 30-day mortality in both cohorts. As we would expect from a good predictive model, the sensitivity starts out very high and decreases with increasing score, while the specificity starts out very low and increases with increasing score. For the clinical application of their model, the authors selected the cut points of 1, 2, and 3 (see Figure 2).

In conclusion, CURB-65 is a simple 5-variable decision aid that is helpful in the initial stratification of mortality risk in patients with CAP.

The wide range of specificities and sensitivities at different values of the CURB-65 score makes it a robust tool for risk stratification. The authors felt that patients with a score of 0-1 were “likely suitable for home treatment,” patients with a score of 2 should have “hospital-supervised treatment,” and patients with score of  ≥ 3 had “severe pneumonia” and should be admitted (with consideration of ICU admission if score of 4 or 5).

Following the publication of the CURB-65 Score, the author of the Pneumonia Severity Index (PSI) published a prospective cohort study of CAP that examined the discriminatory power (area under the receiver operating characteristic curve) of the PSI vs. CURB-65. His study found that the PSI “has a higher discriminatory power for short-term mortality, defines a greater proportion of patients at low risk, and is slightly more accurate in identifying patients at low risk” than the CURB-65 score.

Expert opinion at UpToDate prefers the PSI over the CURB-65 score based on its more robust base of confirmatory evidence. Of note, the author of the PSI is one of the authors of the relevant UpToDate article. In an important contrast from the CURB-65 authors, these experts suggest that patients with a CURB-65 score of 0 be managed as outpatients, while patients with a score of 1 and above “should generally be admitted.”

Further Reading/References:
1. Original publication of the PSI, NEJM (1997)
2. PSI vs. CURB-65 (2005)
3. Wiki Journal Club
4. 2 Minute Medicine
5. UpToDate, “CAP in adults: assessing severity and determining the appropriate level of care”

Summary by Duncan F. Moore, MD

Image Credit: by Christaras A, CC BY-SA 3.0