Week 52 – Symptom-Triggered Benzodiazepines in Alcohol Withdrawal

“Symptom-Triggered vs Fixed-Schedule Doses of Benzodiazepine for Alcohol Withdrawal”

Arch Intern Med. 2002 May 27;162(10):1117-21. [free full text]

Treatment of alcohol withdrawal with benzodiazepines has been the standard of care for decades. However, in the 1990s, benzodiazepine therapy for alcohol withdrawal was generally given via fixed doses. In 1994, a double-blind RCT by Saitz et al. demonstrated that symptom-triggered therapy based on responses to the CIWA-Ar scale reduced treatment duration and the amount of benzodiazepine used relative to a fixed-schedule regimen. This trial had little immediate impact in the treatment of alcohol withdrawal. The authors of the 2002 double-blind RCT sought to confirm the findings from 1994 in a larger population that did not exclude patients with a history of seizures or severe alcohol withdrawal.

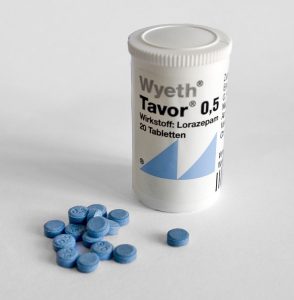
The trial enrolled consecutive patients admitted to the inpatient alcohol treatment units at two European universities (excluding those with “major cognitive, psychiatric, or medical comorbidity”) and randomized them to treatment with either scheduled placebo (30mg q6hrs x4, followed by 15mg q6hrs x8) with additional PRN oxazepam 15mg for CIWA score 8-15 and 30mg for CIWA score > 15 or to treatment with scheduled oxazepam (30mg q6hrs x4, followed by 15mg q6hrs x8) with additional PRN oxazepam 15mg for CIWA score 8-15 and 30mg for CIWA score > 15.

The primary outcomes were cumulative oxazepam dose at 72 hours and duration of treatment with oxazepam. Subgroup analysis included the exclusion of symptomatic patients who did not require any oxazepam. Secondary outcomes included incidence of seizures, hallucinations, and delirium tremens at 72 hours.

Results:
117 patients completed the trial. 56 had been randomized to the symptom-triggered group, and 61 had been randomized to the fixed-schedule group. The groups were similar in all baseline characteristics except that the fixed-schedule group had on average a 5-hour longer interval since last drink prior to admission. While only 39% of the symptom-triggered group actually received oxazepam, 100% of the fixed-schedule group did (p < 0.001). Patients in the symptom-triggered group received a mean cumulative dose of 37.5mg versus 231.4mg in the fixed-schedule group (p < 0.001). The mean duration of oxazepam treatment was 20.0 hours in the symptom-triggered group versus 62.7 hours in the fixed-schedule group. The group difference in total oxazepam dose persisted even when patients who did not receive any oxazepam were excluded. Among patients who did receive oxazepam, patients in the symptom-triggered group received 95.4 ± 107.7mg versus 231.4 ± 29.4mg in the fixed-dose group (p < 0.001). Only one patient in the symptom-triggered group sustained a seizure. There were no seizures, hallucinations, or episodes of delirium tremens in any of the other 116 patients. The two treatment groups had similar quality-of-life and symptom scores aside from slightly higher physical functioning in the symptom-triggered group (p < 0.01). See Table 2.

Implication/Discussion:
Symptom-triggered administration of benzodiazepines in alcohol withdrawal led to a six-fold reduction in cumulative benzodiazepine use and a much shorter duration of pharmacotherapy than fixed-schedule administration. This more restrictive and responsive strategy did not increase the risk of major adverse outcomes such as seizure or DTs and also did not result in increased patient discomfort.

Overall, this study confirmed the findings of the landmark study by Saitz et al. from eight years prior. Additionally, this trial was larger and did not exclude patients with a prior history of withdrawal seizures or severe withdrawal. The fact that both studies took place in inpatient specialty psychiatry units limits their generalizability to our inpatient general medicine populations.

Why the initial 1994 study did not gain clinical traction remains unclear. Both studies have been well-cited over the ensuing decades, and the paradigm has shifted firmly toward symptom-triggered benzodiazepine regimens using the CIWA scale. While a 2010 Cochrane review cites only the 1994 study, Wiki Journal Club and 2 Minute Medicine have entries on this 2002 study but not on the equally impressive 1994 study.

Further Reading/References:
1. “Individualized treatment for alcohol withdrawal. A randomized double-blind controlled trial.” JAMA. 1994.
2. Clinical Institute Withdrawal Assessment of Alcohol Scale, Revised (CIWA-Ar)
3. Wiki Journal Club
4. 2 Minute Medicine
5. “Benzodiazepines for alcohol withdrawal.” Cochrane Database Syst Rev. 2010

Summary by Duncan F. Moore, MD

Image Credit: VisualBeo, CC BY-SA 3.0, via Wikimedia Commons

Week 48 – Sepsis-3

“The Third International Consensus Definitions for Sepsis and Septic Shock (Sepsis-3)”

JAMA. 2016 Feb 23;315(8):801-10. [free full text]

In practice, we recognize sepsis as a potentially life-threatening condition that arises secondary to infection. Because the SIRS criteria were of limited sensitivity and specificity in identifying sepsis and because our understanding of the pathophysiology of sepsis had purportedly advanced significantly during the interval since the last sepsis definition, an international task force of 19 experts was convened to define and prognosticate sepsis more effectively. The resulting 2016 Sepsis-3 definition was the subject of immediate and sustained controversy.

In the words of Sepsis-3, sepsis simply “is defined as life-threatening organ dysfunction caused by a dysregulated host response to infection.” The paper further defines organ dysfunction in terms of a threshold change in the SOFA score by 2+ points. However, the authors state that “the SOFA score is not intended to be used as a tool for patient management but as a means to clinically characterize a septic patient.” The authors note that qSOFA, an easier tool introduced in this paper, can identify promptly at the bedside patients “with suspected infection who are likely to have a prolonged ICU stay or die in the hospital.” A positive screen on qSOFA is identified as 2+ of the following: AMS, SBP ≤ 100, or respiratory rate ≥ 22. At the time of this endorsement of qSOFA, the tool had not been validated prospectively. Finally, septic shock was defined as sepsis with persistent hypotension requiring vasopressors to maintain MAP ≥ 65 and with a serum lactate > 2 despite adequate volume resuscitation.

As noted contemporaneously in the excellent PulmCrit blog post “Top ten problems with the new sepsis definition,” Sepsis-3 was not endorsed by the American College of Chest Physicians, the IDSA, any emergency medicine society, or any hospital medicine society. On behalf of the American College of Chest Physicians, Dr. Simpson published a scathing rejection of Sepsis-3 in Chest in May 2016. He noted “there is still no known precise pathophysiological feature that defines sepsis.” He went on to state “it is not clear to us that readjusting the sepsis criteria to be more specific for mortality is an exercise that benefits patients,” and said “to abandon one system of recognizing sepsis [SIRS] because it is imperfect and not yet in universal use for another system that is used even less seems unwise without prospective validation of that new system’s utility.”

In fact, the later validation of qSOFA demonstrated that the SIRS criteria had superior sensitivity for predicting in-hospital mortality while qSOFA had higher specificity. See the following posts at PulmCrit for further discussion: [https://emcrit.org/isepsis/isepsis-sepsis-3-0-much-nothing/] [https://emcrit.org/isepsis/isepsis-sepsis-3-0-flogging-dead-horse/].

At UpToDate, authors note that “data of the value of qSOFA is conflicting,” and because of this, “we believe that further studies that demonstrate improved clinically meaningful outcomes due to the use of qSOFA compared to clinical judgement are warranted before it can be routinely used to predict those at risk of death from sepsis.”

Additional Reading:
1. PulmCCM, “Simple qSOFA score predicts sepsis as well as anything else”
2. 2 Minute Medicine

Summary by Duncan F. Moore, MD

Image Credit: Mark Oniffrey, CC BY-SA 4.0, via Wikimedia Commons

Week 41 – HAS-BLED


“A Novel User-Friendly Score (HAS-BLED) To Assess 1-Year Risk of Major Bleeding in Patients with Atrial Fibrillation”

Chest. 2010 Nov;138(5):1093-100. [free full text]

Atrial fibrillation (AF) is a well-known risk factor for ischemic stroke. Stroke risk is further increased by individual comorbidities, such as CHF, HTN, and DM, and can be stratified with scores, such as CHADS2 and CHA2DS2VASC. Patients with intermediate stroke risk are recommended to be treated with oral anticoagulation (OAC). However, stroke risk is often also closely related to bleeding risk, and the benefits of anticoagulation for stroke need to be weighed against the added risk of bleeding. At the time of this study, there were no validated and user-friendly bleeding risk-stratification schemes. This study aimed to develop a practical risk score to estimate the 1-year risk of major bleeding (as defined in the study) in a contemporary, real world cohort of patients with AF.

The study enrolled adults with an EKG or Holter-proven diagnosis of AF. (Patients with mitral valve stenosis or previous valvular surgery were excluded.) No experiment was performed in this retrospective cohort study.

In a derivation cohort, the authors retrospectively performed univariate analyses to identify a range of clinical features associated with major bleeding (p < 0.10). Based on systematic reviews, they added additional risk factors for major bleeding. Ultimately, what resulted was a list of comprehensive risk factors deemed HAS-BLED:

H – Hypertension (> 160 mmHg systolic)

A – Abnormal renal (HD, transplant, Cr > 2.26 mg/dL) and liver function (cirrhosis, bilirubin > 2x normal w/ AST/ALT/ALP > 3x normal) – 1 pt each for abnormal renal or liver function

S – Stroke

B – Bleeding (prior major bleed or predisposition to bleed)

L – Labile INRs (time in therapeutic range < 60%)

E – Elderly (age > 65)

D – Drugs (i.e. ASA, clopidogrel, NSAIDs) or alcohol use (> 8 units per week) concomitantly – 1 pt each for use of either

Each risk factor was equivalent to one point. The HAS-BLED score was then compared to the HEMORR2HAGES scheme, a prior tool for estimating bleeding risk.

Outcomes:

      • incidence of major bleeding within 1 year, overall
      • bleeds per 100 patient-years, by HAS-BLED score
      • c-statistic for the HAS-BLED score in predicting the risk of bleeding

Definitions:

      • major bleeding = bleeding causing hospitalization, Hgb drop >2 g/L, or requiring blood transfusion, that was not a hemorrhagic stroke
      • hemorrhagic stroke = focal neurologic deficit of sudden onset, diagnosed by a neurologist, lasting >24h and caused by bleeding

Results:
3,456 patients with AF without mitral valve stenosis or valve surgery who completed their 1-year follow-up were analyzed retrospectively. 64.8% (2242) of these patients were on OAC (12.8% of whom on concurrent antiplatelet therapy), 24% (828) were on antiplatelet therapy alone, and 10.2% (352) received no antithrombotic therapy. 1.5% (53) of patients experienced a major bleed during the first year, with 17% (9) of these patients sustaining intracerebral hemorrhage.

HAS-BLED Score       Bleeds per 100-patient years
0                                       1.13
1                                       1.02
2                                       1.88
3                                       3.74
4                                       8.70
5                                      12.50
6*                                    0.0                   *(n = 2 patients at risk, neither bled)

Patients were given a HAS-BLED score and a HEMORR2HAGES score. C-statistics were then used to determine the predictive accuracy of each model overall as well as within patient subgroups (OAC alone, OAC + antiplatelet, antiplatelet alone, no antithrombotic therapy).

C statistics for HAS-BLED were as follows: for overall cohort, 0.72 (95%CI 0.65-0.79); for OAC alone, 0.69 (95%CI 0.59-0.80); for OAC + antiplatelet, 0.78 (95%CI 0.65-0.91); for antiplatelet alone, 0.91 (95%CI 0.83-1.00); and for those on no antithrombotic therapy, 0.85 (95%CI 0.00-1.00).

C statistics for HEMORR2HAGES were as follows: for overall cohort, 0.66 (95%CI 0.57-0.74); for OAC alone, 0.64 (95%CI 0.53-0.75); for OAC + antiplatelet, 0.83 (95%CI 0.74-0.91); for antiplatelet alone, 0.83 (95%CI 0.68-0.98); and for those without antithrombotic therapy, 0.81 (95%CI 0.00-1.00).

Implication/Discussion:
This study helped to establish a practical and user-friendly assessment of bleeding risk in AF. HAS-BLED is superior to its predecessor HEMORR2HAGES in that it has an easier-to-remember acronym and is quicker and simpler to perform. All of its risk factors are readily available from the clinical history or are routinely tested. Both stratification tools had a broadly similar c-statistics for the overall cohort – 0.72 for HAS-BLED versus 0.66 for HEMORR2HAGES respectively. However, HAS-BLED was particularly useful when looking at antiplatelet therapy alone or no antithrombotic therapy at all (0.91 and 0.85, respectively).

This study is useful because it provides evidence-based, easily-calculable, and actionable risk stratification in assessing bleeding risk in AF. In prior studies, such as ACTIVE-A (ASA + clopidogrel versus ASA alone for patients with AF deemed unsuitable for OAC), almost half of all patients (n= ~3500) were given a classification of “unsuitable for OAC,” which was based solely on physician clinical judgement alone without a predefined objective scoring. Now, physicians have an objective way to assess bleed risk rather than “gut feeling” or wanting to avoid iatrogenic insult.

The RE-LY trial used the HAS-BLED score to decide which patients with AF should get the standard dabigatran dose (150mg BID) versus a lower dose (110mg BID) for anticoagulation. This risk-stratified dosing resulted in a significant reduction in major bleeding compared with warfarin and maintained a similar reduction in stroke risk.

Furthermore, the HAS-BLED score could allow the physician to be more confident when deciding which patients may be appropriate for referral for a left atrial appendage occlusion device (e.g. Watchman).

Limitations:
The study had a limited number of major bleeds and a short follow-up period, and thus it is possible that other important risk factors for bleeding were not identified. Also, there were large numbers of patients lost to 1-year follow-up. These patients were likely to have had more comorbidities and may have transferred to nursing homes or even have died – which may have led to an underestimate of bleeding rates. Furthermore, the study had a modest number of very elderly patients (i.e. 75-84 and ≥ 85), who are likely to represent the greatest bleeding risk.

Bottom Line:
HAS-BLED provides an easy, practical tool to assess the individual bleeding risk of patients with AF. Oral anticoagulation should be considered for scores of 3 or less. When HAS-BLED scores are ≥ 4, it is reasonable to think about alternatives to oral anticoagulation.

Further Reading/References:
1. HAS-BLED @ 2 Minute Medicine
2. ACTIVE-A trial
3. RE-LY trial
4. RE-LY @ Wiki Journal Club
5. HAS-BLED Calculator
6. HEMORR2HAGES Calculator
7. CHADS2 Calculator
8. CHA2DS2VASC Calculator
9. Watchman (for Healthcare Professionals)
10. “Bleeding Risk Scores in Atrial Fibrillation: Helpful or Harmful?” Journal of the American Heart Association (2018)

Summary by Patrick Miller, MD

Image Credit: CardioNetworks, CC BY-SA 3.0, via Wikimedia Commons

Week 35 – POISE

“Effects of extended-release metoprolol succinate in patients undergoing non-cardiac surgery: a randomised controlled trial”

aka the PeriOperative Ischemic Evaluation (POISE) trial

Lancet. 2008 May 31;371(9627):1839-47. [free full text]

Non-cardiac surgery is commonly associated with major cardiovascular complications. It has been hypothesized that perioperative beta blockade would reduce such events by attenuating the effects of the intraoperative increases in catecholamine levels. Prior to the 2008 POISE trial, small- and moderate-sized trials had revealed inconsistent results, alternately demonstrating benefit and non-benefit with perioperative beta blockade. The POISE trial was a large RCT designed to assess the benefit of extended-release metoprolol succinate (vs. placebo) in reducing major cardiovascular events in patients of elevated cardiovascular risk.

The trial enrolled patients age 45+ undergoing non-cardiac surgery with estimated LOS 24+ hrs and elevated risk of cardiac disease, meaning: either 1) hx of CAD, 2) peripheral vascular disease, 3) hospitalization for CHF within past 3 years, 4) undergoing major vascular surgery, 5) or any three of the following seven risk criteria: undergoing intrathoracic or intraperitoneal surgery, hx CHF, hx TIA, hx DM, Cr > 2.0, age 70+, or undergoing urgent/emergent surgery.

Notable exclusion criteria: HR < 50, 2nd or 3rd degree heart block, asthma, already on beta blocker, prior intolerance of beta blocker, hx CABG within 5 years and no cardiac ischemia since

Intervention: metoprolol succinate (extended-release) 100mg PO starting 2-4 hrs before surgery, additional 100mg at 6-12 hrs postoperatively, followed by 200mg daily for 30 days.

Patients unable to take PO meds postoperatively were given metoprolol infusion.


Comparison: placebo PO / IV at same frequency as metoprolol arm

Outcome:
Primary – composite of cardiovascular death, non-fatal MI, and non-fatal cardiac arrest at 30 days

Secondary (at 30 days)

      • cardiovascular death
      • non-fatal MI
      • non-fatal cardiac arrest
      • all-cause mortality
      • non-cardiovascular death
      • MI
      • cardiac revascularization
      • stroke
      • non-fatal stroke
      • CHF
      • new, clinically significant atrial fibrillation
      • clinically significant hypotension
      • clinically significant bradycardia


Pre-specified subgroup analyses of primary outcome:

Results:
9298 patients were randomized. However, fraudulent activity was detected at participating sites in Iran and Colombia, and thus 947 patients from these sites were excluded from the final analyses. Ultimately, 4174 were randomized to the metoprolol group, and 4177 were randomized to the placebo group. There were no significant differences in baseline characteristics, pre-operative cardiac medications, surgery type, or anesthesia type between the two groups (see Table 1).

Regarding the primary outcome, metoprolol patients were less likely than placebo patients to experience the primary composite endpoint of cardiovascular death, non-fatal MI, and non-fatal cardiac arrest (HR 0.84, 95% CI 0.70-0.99, p = 0.0399). See Figure 2A for the relevant Kaplan-Meier curve. Note that the curves separate distinctly within the first several days.

Regarding selected secondary outcomes (see Table 3 for full list), metoprolol patients were more likely to die from any cause (HR 1.33, 95% CI 1.03-1.74, p = 0.0317). See Figure 2D for the Kaplan-Meier curve for all-cause mortality. Note that the curves start to separate around day 10. Cause of death was analyzed, and the only group difference in attributable cause was an increased number of deaths due to sepsis or infection in the metoprolol group (data not shown). Metoprolol patients were more likely to sustain a stroke (HR 2.17, 95% CI 1.26-3.74, p = 0.0053) or a non-fatal stroke (HR 1.94, 95% CI 1.01-3.69, p = 0.0450). Of all patients who sustained a non-fatal stroke, only 15-20% made a full recovery. Metoprolol patients were less likely to sustain new-onset atrial fibrillation (HR 0.76, 95% CI 0.58-0.99, p = 0.0435) and less likely to sustain a non-fatal MI (HR 0.70, 95% CI 0.57-0.86, p = 0.0008). There were no group differences in risk of cardiovascular death or non-fatal cardiac arrest. Metoprolol patients were more likely to sustain clinically significant hypotension (HR 1.55, 95% CI 1.38-1.74, p < 0.0001) and clinically significant bradycardia (HR 2.74, 95% CI 2.19-3.43, p < 0.0001).

Subgroup analysis did not reveal any significant interaction with the primary outcome by RCRI, sex, type of surgery, or anesthesia type.

Implication/Discussion:
In patients with cardiovascular risk factors undergoing non-cardiac surgery, the perioperative initiation of beta blockade decreased the composite risk of cardiovascular death, non-fatal MI, and non-fatal cardiac arrest and increased the overall mortality risk and risk of stroke.

This study affirms its central hypothesis – that blunting the catecholamine surge of surgery is beneficial from a cardiac standpoint. (Most patients in this study had an RCRI of 1 or 2.) However, the attendant increase in all-cause mortality is dramatic. The increased mortality is thought to result from delayed recognition of sepsis due to masking of tachycardia. Beta blockade may also limit the physiologic hemodynamic response necessary to successfully fight a serious infection. In retrospective analyses mentioned in the discussion, the investigators state that they cannot fully explain the increased risk of stroke in the metoprolol group. However, hypotension attributable to beta blockade explains about half of the increased number of strokes.

Overall, the authors conclude that “patients are unlikely to accept the risks associated with perioperative extended-release metoprolol.”

A major limitation of this study is the fact that 10% of enrolled patients were discarded in analysis due to fraudulent activity at selected investigation sites. In terms of generalizability, it is important to remember that POISE excluded patients who were already on beta blockers.

POISE is an important piece of evidence underpinning the 2014 ACC/AHA Guideline on Perioperative Cardiovascular Evaluation and Management of Patients Undergoing Noncardiac Surgery, which includes the following recommendations regarding beta blockers:

      • Beta blocker therapy should not be started on the day of surgery (Class III – Harm, Level B)
      • Continue beta blockers in patients who are on beta blockers chronically (Class I, Level B)
      • In patients with intermediate- or high-risk preoperative tests, it may be reasonable to begin beta blockers
      • In patients with ≥ 3 RCRI risk factors, it may be reasonable to begin beta blockers before surgery
      • Initiating beta blockers in the perioperative setting as an approach to reduce perioperative risk is of uncertain benefit in those with a long-term indication but no other RCRI risk factors
      • It may be reasonable to begin perioperative beta blockers long enough in advance to assess safety and tolerability, preferably > 1 day before surgery

Further Reading/References:
1. POISE @ Wiki Journal Club
2. POISE @ 2 Minute Medicine
3. UpToDate, “Management of cardiac risk for noncardiac surgery”
4. 2014 ACC/AHA guideline on perioperative cardiovascular evaluation and management of patients undergoing noncardiac surgery: a report of the American College of Cardiology/American Heart Association Task Force on practice guidelines.

Image Credit: Mark Oniffrey, CC BY-SA 4.0, via Wikimedia Commons

Summary by Duncan F. Moore, MD

Week 33 – ALLHAT

“Major Outcomes in High-Risk Hypertensive Patients Randomized to Angiotensin-Converting Enzyme Inhibitor or Calcium Channel Blocker vs. Diuretic”

The Antihypertensive and Lipid-Lowering Treatment to Prevent Heart Attack Trial (ALLHAT)

JAMA. 2002 Dec 18;288(23):2981-97. [free full text]

Hypertension is a ubiquitous disease, and the cardiovascular and mortality benefits of BP control have been well described. However, as the number of available antihypertensive classes proliferated in the past several decades, a head-to-head comparison of different antihypertensive regimens was necessary to determine the optimal first-step therapy. The 2002 ALLHAT trial was a landmark trial in this effort.

Population:
33,357 patients aged 55 years or older with hypertension and at least one other coronary heart disease (CHD) risk factor (previous MI or stroke, LVH by ECG or echo, T2DM, current cigarette smoking, HDL < 35 mg/dL, or documentation of other atherosclerotic cardiovascular disease (CVD)). Notable exclusion criteria: history of hospitalization for CHF, history of treated symptomatic CHF, or known LVEF < 35%.

Intervention:
Prior antihypertensives were discontinued upon initiation of the study drug. Patients were randomized to one of three study drugs in a double-blind fashion. Study drugs and additional drugs were added in a step-wise fashion to achieve a goal BP < 140/90 mmHg.

Step 1: titrate assigned study drug

      • chlorthalidone: 12.5 –> 12.5 (sham titration) –> 25 mg/day
      • amlodipine: 2.5 –> 5 –> 10 mg/day
      • lisinopril: 10 –> 20 –> 40 mg/day

Step 2: add open-label agents at treating physician’s discretion (atenolol, clonidine, or reserpine)

      • atenolol: 25 to 100 mg/day
      • reserpine: 0.05 to 0.2 mg/day
      • clonidine: 0.1 to 0.3 mg BID

Step 3: add hydralazine 25 to 100 mg BID

Comparison:
Pairwise comparisons with respect to outcomes of chlorthalidone vs. either amlodipine or lisinopril. A doxazosin arm existed initially, but it was terminated early due to an excess of CV events, primarily driven by CHF.

Outcomes:
Primary –  combined fatal CAD or nonfatal MI

Secondary

      • all-cause mortality
      • fatal and nonfatal stroke
      • combined CHD (primary outcome, PCI, or hospitalized angina)
      • combined CVD (CHD, stroke, non-hospitalized treated angina, CHF [fatal, hospitalized, or treated non-hospitalized], and PAD)

Results:
Over a mean follow-up period of 4.9 years, there was no difference between the groups in either the primary outcome or all-cause mortality.

When compared with chlorthalidone at 5 years, the amlodipine and lisinopril groups had significantly higher systolic blood pressures (by 0.8 mmHg and 2 mmHg, respectively). The amlodipine group had a lower diastolic blood pressure when compared to the chlorthalidone group (0.8 mmHg).

When comparing amlodipine to chlorthalidone for the pre-specified secondary outcomes, amlodipine was associated with an increased risk of heart failure (RR 1.38; 95% CI 1.25-1.52).

When comparing lisinopril to chlorthalidone for the pre-specified secondary outcomes, lisinopril was associated with an increased risk of stroke (RR 1.15; 95% CI 1.02-1.30), combined CVD (RR 1.10; 95% CI 1.05-1.16), and heart failure (RR 1.20; 95% CI 1.09-1.34). The increased risk of stroke was mostly driven by 3 subgroups: women (RR 1.22; 95% CI 1.01-1.46), blacks (RR 1.40; 95% CI 1.17-1.68), and non-diabetics (RR 1.23; 95% CI 1.05-1.44). The increased risk of CVD was statistically significant in all subgroups except in patients aged less than 65. The increased risk of heart failure was statistically significant in all subgroups.

Discussion:
In patients with hypertension and one risk factor for CAD, chlorthalidone, lisinopril, and amlodipine performed similarly in reducing the risks of fatal CAD and nonfatal MI.

The study has several strengths: a large and diverse study population, a randomized, double-blind structure, and the rigorous evaluation of three of the most commonly prescribed “newer” classes of antihypertensives. Unfortunately, neither an ARB nor an aldosterone antagonist was included in the study. Additionally, the step-up therapies were not reflective of contemporary practice. (Instead, patients would likely be prescribed one or more of the primary study drugs.)

The ALLHAT study is one of the hallmark studies of hypertension and has played an important role in hypertension guidelines since it was published. Following the publication of ALLHAT, thiazide diuretics became widely used as first line drugs in the treatment of hypertension. The low cost of thiazides and their limited side-effect profile are particularly attractive class features. While ALLHAT looked specifically at chlorthalidone, in practice the positive findings were attributed to HCTZ, which has been more often prescribed. The authors of ALLHAT argued that the superiority of thiazides was likely a class effect, but according to the analysis at Wiki Journal Club, “there is little direct evidence that HCTZ specifically reduces the incidence of CVD among hypertensive individuals.” Furthermore, a 2006 study noted that that HCTZ has worse 24-hour BP control than chlorthalidone due to a shorter half-life. The ALLHAT authors note that “since a large proportion of participants required more than 1 drug to control their BP, it is reasonable to infer that a diuretic be included in all multi-drug regimens, if possible.” The 2017 ACC/AHA High Blood Pressure Guidelines state that, of the four thiazide diuretics on the market, chlorthalidone is preferred because of a prolonged half-life and trial-proven reduction of CVD (via the ALLHAT study).

Further Reading / References:
1. 2017 ACC Hypertension Guidelines
2. ALLHAT @ Wiki Journal Club
3. 2 Minute Medicine
4. Ernst et al, “Comparative antihypertensive effects of hydrochlorothiazide and chlorthalidone on ambulatory and office blood pressure.” (2006)
5. Gillis Pharmaceuticals
6. Concepts in Hypertension, Volume 2 Issue 6

Summary by Ryan Commins MD

Image Credit: Kimivanil, CC BY-SA 4.0, via Wikimedia Commons

Week 32 – PneumA

“Comparison of 8 vs 15 Days of Antibiotic Therapy for Ventilator-Associated Pneumonia in Adults”

JAMA. 2003 November 19;290(19):2588-2598. [free full text]

Ventilator-associated pneumonia (VAP) is a frequent complication of mechanical ventilation and, prior to this study, few trials had addressed the optimal duration of antibiotic therapy in VAP. Thus, patients frequently received 14- to 21-day antibiotic courses. As antibiotic stewardship efforts increased and awareness grew of the association between prolonged antibiotic courses and the development of multidrug resistant (MDR) infections, more data were needed to clarify the optimal VAP treatment duration.

This 2003 trial by the PneumA Trial Group was the first large randomized trial to compare shorter (8-day) versus longer (15-day) treatment courses for VAP.

The noninferiority study, carried out in 51 French ICUs, enrolled intubated patients with clinical suspicion for VAP and randomized them to either 8 or 15 days of antimicrobials. Antimicrobial regimens were chosen by the treating clinician. 401 patients met eligibility criteria. 197 were randomized to the 8-day regimen. 204 patients were randomized to the 15-day regimen. Study participants were blinded to randomization assignment until day 8. Analysis was performed using an intention-to-treat model. The primary outcomes measured were death from any cause at 28 days, antibiotic-free days, and microbiologically documented pulmonary infection recurrence.

Study findings demonstrated a similar 28-day mortality in both groups (18.8% mortality in 8-day group vs. 17.2% in 15-day group, group difference 90% CI -3.7% to 6.9%). The 8-day group did not develop more recurrent infections (28.9% in 8-day group vs. 26.0% in 15-day group, group difference 90% CI -3.2% to 9.1%). The 8-day group did have more antibiotic-free days when measured at the 28-day point (13.1 in 8-day group vs. 8.7 in 15-day group, p<0.001). A subgroup analysis did show that more 8-day-group patients who had an initial infection with lactose-nonfermenting GNRs developed a recurrent pulmonary infection, so noninferiority was not established in this specific subgroup (40.6% recurrent GNR infection in 8-day group vs. 25.4% in 15-day group, group difference 90% CI 3.9% to 26.6%).

Implications/Discussion:
There is no benefit to prolonging VAP treatment to 15 days (except perhaps when Pseudomonas aeruginosa is suspected based on gram stain/culture data). Shorter courses of antibiotics for VAP treatment allow for less antibiotic exposure without increasing rates of recurrent infection or mortality.

The 2016 IDSA guidelines on VAP treatment recommend a 7-day course of antimicrobials for treatment of VAP (as opposed to a longer treatment course such as 8-15 days). These guidelines are based on the IDSA’s own large meta-analysis (of 10 randomized trials, including PneumA, as well as an observational study) which demonstrated that shorter courses of antibiotics (7 days) reduce antibiotic exposure and recurrent pneumonia due to MDR organisms without affecting clinical outcomes, such as mortality. Of note, this 7-day course recommendation also applies to treatment of lactose-nonfermenting GNRs, such as Pseudomonas.

When considering the PneumA trial within the context of the newest IDSA guidelines, we see that we now have over 15 years of evidence supporting the use of shorter VAP treatment courses.

Further Reading/References:
1. 2016 IDSA Guidelines for the Management of HAP/VAP
2. PneumA @ Wiki Journal Club
3. PulmCCM “IDSA Guidelines 2016: HAP, VAP & It’s the End of HCAP as We Know It (And I Feel Fine)”
4. PulmCrit “The siren’s call: Double-coverage for ventilator associated PNA”

Summary by Liz Novick, MD

Week 29 – CHADS2

“Validation of Clinical Classification Schemes for Predicting Stroke”

JAMA. 2001 June 13;285(22):2864-70. [free full text]

Atrial fibrillation is the most common cardiac arrhythmia and affects 1-2% of the overall population with increasing prevalence as people age. Atrial fibrillation also carries substantial morbidity and mortality due to the risk of stroke and thromboembolism although the risk of embolic phenomena varies widely across various subpopulations. In 2001, the only oral anticoagulation options available were warfarin and aspirin, which had relative risk reductions of 62% and 22%, respectively, consistent across these subpopulations. Clinicians felt that high risk patients should be anticoagulated, but the two common classification schemes, AFI and SPAF, were flawed. Patients were often classified as low risk in one scheme and high risk in the other. The schemes were derived retrospectively and were clinically ambiguous. Therefore, in 2001, a group of investigators combined the two existing schemes to create the CHADS2 scheme and applied it to a new data set.

Population (NRAF cohort): Hospitalized Medicare patients ages 65-95 with non-valvular AF not prescribed warfarin at hospital discharge.

Intervention: Determination of CHADS2 score (1 point for recent CHF, hypertension, age ≥ 75, and DM; 2 points for a history of stroke or TIA)

Comparison: AFI and SPAF risk schemes

Measured Outcome: Hospitalization rates for ischemic stroke (per ICD-9 codes from Medicare claims), stratified by CHADS2 / AFI / SPAF scores.

Calculated Outcome: performance of the various schemes, based on c statistic (a measure of predictive accuracy in a binary logistic regression model)

Results:
1733 patients were identified in the NRAF cohort. When compared to the AFI and SPAF trials, these patients tended be older (81 in NRAF vs. 69 in AFI vs. 69 in SPAF), have a higher burden of CHF (56% vs. 22% vs. 21%), are more likely to be female (58% vs. 34% vs. 28%), and have a history of DM (23% vs. 15% vs. 15%) or prior stroke/TIA (25% vs. 17% vs. 8%). The stroke rate was lowest in the group with a CHADS2 = 0 (1.9 per 100 patient years, adjusting for the assumption that aspirin was not taken). The stroke rate increased by a factor of approximately 1.5 for each 1-point increase in the CHADS2 score.

CHADS2 score            NRAF Adjusted Stroke Rate per 100 Patient-Years
0                                      1.9
1                                       2.8
2                                      4.0
3                                      5.9
4                                      8.5
5                                      12.5
6                                      18.2

The CHADS2 scheme had a c statistic of 0.82 compared to 0.68 for the AFI scheme and 0.74 for the SPAF scheme.

Implication/Discussion
The CHADS2 scheme provides clinicians with a scoring system to help guide decision making for anticoagulation in patients with non-valvular AF.

The authors note that the application of the CHADS2 score could be useful in several clinical scenarios. First, it easily identifies patients at low risk of stroke (CHADS2 = 0) for whom anticoagulation with warfarin would probably not provide significant benefit. The authors argue that these patients should merely be offered aspirin. Second, the CHADS2 score could facilitate medication selection based on a patient-specific risk of stroke. Third, the CHADS2 score could help clinicians make decisions regarding anticoagulation in the perioperative setting by evaluating the risk of stroke against the hemorrhagic risk of the procedure. Although the CHADS2 is no longer the preferred risk-stratification scheme, the same concepts are still applicable to the more commonly used CHA2DS2-VASc.

This study had several strengths. First, the cohort was from seven states that represented all geographic regions of the United States. Second, CHADS2 was pre-specified based on previous studies and validated using the NRAF data set. Third, the NRAF data set was obtained from actual patient chart review as opposed to purely from an administrative database. Finally, the NRAF patients were older and sicker than those of the AFI and SPAF cohorts, and thus the CHADS2 appears to be generalizable to the very large demographic of frail, elderly Medicare patients.

As CHADS2 became widely used clinically in the early 2000s, its application to other cohorts generated a large intermediate-risk group (CHADS2 = 1), which was sometimes > 60% of the cohort (though in the NRAF cohort, CHADS2 = 1 accounted for 27% of the cohort). In clinical practice, this intermediate-risk group was to be offered either warfarin or aspirin. Clearly, a clinical-risk predictor that does not provide clear guidance in over 50% of patients needs to be improved. As a result, the CHA2DS2-VASc scoring system was developed from the Birmingham 2009 scheme. When compared head-to-head in registry data, CHA2DS2-VASc more effectively discriminated stroke risk among patients with a baseline CHADS2 score of 0 to 1. Because of this, CHA2DS2-VASc is the recommended risk stratification scheme in the most recent AHA/ACC/HRS guidelines. In modern practice, anticoagulation is unnecessary when CHA2DS2-VASc score = 0, should be considered (vs. antiplatelet or no treatment) when score = 1, and is recommended when score ≥ 2.

Further Reading:
1. 2019 AHA/ACC/HRS Focused Update of the 2014 AHA/ACC/HRS Guideline for the Management of Patients With Atrial Fibrillation
2. CHA2DS2-VASc in Chest (2010)
3. CHADS2 @ 2 Minute Medicine

Summary by Ryan Commins, MD

Image Credit: Alisa Machalek, NIGMS/NIH – National Institute of General Medical Sciences, Public Domain, via Wikimedia Commons

Week 20 – MELD

“A Model to Predict Survival in Patients With End-Stage Liver Disease”

Hepatology. 2001 Feb;33(2):464-70. [free full text]

Prior to the adoption of the Model for End-Stage Liver Disease (MELD) score for the allocation of liver transplants, the determination of medical urgency was dependent on the Child-Pugh score. The Child-Pugh score was limited by the inclusion of two subjective variables (severity of ascites and severity of encephalopathy), limited discriminatory ability, and a ceiling effect of laboratory abnormalities. Stakeholders sought an objective, continuous, generalizable index that more accurately and reliably represented disease severity. The MELD score had originally been developed in 2000 to estimate the survival of patients undergoing TIPS. The authors of this 2001 study hypothesized that the MELD score would accurately estimate short-term survival in a wide range of severities and etiologies of liver dysfunction and thus serve as a suitable replacement measure for the Child-Pugh score in the determination of medical urgency in transplant allocation.

This study reported a series of four retrospective validation cohorts for the use of MELD in prediction of mortality in advanced liver disease. The index MELD score was calculated for each patient. Death during follow-up was assessed by chart review.

MELD score = 3.8*ln([bilirubin])+11.2*ln(INR)+9.6*ln([Cr])+6.4*(etiology: 0 if cholestatic or alcoholic, 1 otherwise)

The primary study outcome was the concordance c-statistic between MELD score and 3-month survival. The c-statistic is equivalent to the area under receiver operating characteristic (AUROC). Per the authors, “a c-statistic between 0.8 and 0.9 indicates excellent diagnostic accuracy and a c-statistic greater than 0.7 is generally considered as a useful test.” (See page 455 for further explanation.) There was no reliable comparison statistic (e.g. c-statistic of MELD vs. that of Child-Pugh in all groups).

C-statistic for 3-month survival in the four cohorts ranged from 0.78 to 0.87 (no 95% CIs exceeded 1.0). There was minimal improvement in the c-statistics for 3-month survival with the individual addition of spontaneous bacterial peritonitis, variceal bleed, ascites, and encephalopathy to the MELD score (see Table 4, highest increase in c-statistic was 0.03). When the etiology of liver disease was excluded from the MELD score, there was minimal change in the c-statistics (see Table 5, all paired CIs overlap). C-statistics for 1-week mortality ranged from 0.80 to 0.95.

In conclusion, the MELD score is an excellent predictor of short-term mortality in patients with end-stage liver disease of diverse etiology and severity. Despite the retrospective nature of this study, this study represented a significant improvement upon the Child-Pugh score in determining medical urgency in patients who require liver transplant. In 2002, the United Network for Organ Sharing (UNOS) adopted a modified version of the MELD score for the prioritization of deceased-donor liver transplants in cirrhosis. Concurrent with the 2001 publication of this study, Wiesner et al. performed a prospective validation of the use of MELD in the allocation of liver transplantation. When published in 2003, it demonstrated that MELD score accurately predicted 3-month mortality among patients with chronic liver disease on the waitlist. The MELD score has also been validated in other conditions such as alcoholic hepatitis, hepatorenal syndrome, and acute liver failure (see UpToDate). Subsequent additions to the MELD score have come out over the years. In 2006, the MELD Exception Guidelines offered extra points for severe comorbidities (e.g HCC, hepatopulmonary syndrome). In January 2016, the MELDNa score was adopted and is now used for liver transplant prioritization.

References and Further Reading:
1. “A model to predict poor survival in patients undergoing transjugular intrahepatic portosystemic shunts” (2000)
2. MDCalc “MELD Score”
3. Wiesner et al. “Model for end-stage liver disease (MELD) and allocation of donor livers” (2003)
4. Freeman Jr. et al. “MELD exception guidelines” (2006)
5. MELD @ 2 Minute Medicine
6. UpToDate “Model for End-stage Liver Disease (MELD)”

Summary by Duncan F. Moore, MD

Image Credit: Ed Uthman, CC-BY-2.0, via WikiMedia Commons

Week 17 – CURB-65

“Defining community acquired pneumonia severity on presentation to hospital: an international derivation and validation study”

Thorax. 2003 May;58(5):377-82. [free full text]

Community-acquired pneumonia (CAP) is frequently encountered by the admitting medicine team. Ideally, the patient’s severity at presentation and risk for further decompensation should determine the appropriate setting for further care, whether as an outpatient, on an inpatient ward, or in the ICU. At the time of this 2003 study, the predominant decision aid was the 20-variable Pneumonia Severity Index. The authors of this study sought to develop a simpler decision aid for determining the appropriate level of care at presentation.

The study examined the 30-day mortality rates of adults admitted for CAP via the ED at three non-US academic medical centers (data from three previous CAP cohort studies). 80% of the dataset was analyzed as a derivation cohort – meaning it was used to identify statistically significant, clinically relevant prognostic factors that allowed for mortality risk stratification. The resulting model was applied to the remaining 20% of the dataset (the validation cohort) in order to assess the accuracy of its predictive ability.

The following variables were integrated into the final model (CURB-65):

      1. Confusion
      2. Urea > 19mg/dL (7 mmol/L)
      3. Respiratory rate ≥ 30 breaths/min
      4. low Blood pressure (systolic BP < 90 mmHg or diastolic BP < 60 mmHg)
      5. age ≥ 65

1068 patients were analyzed. 821 (77%) were in the derivation cohort. 86% of patients received IV antibiotics, 5% were admitted to the ICU, and 4% were intubated. 30-day mortality was 9%. 9 of 11 clinical features examined in univariate analysis were statistically significant (see Table 2).

Ultimately, using the above-described CURB-65 model, in which 1 point is assigned for each clinical characteristic, patients with a CURB-65 score of 0 or 1 had 1.5% mortality, patients with a score of 2 had 9.2% mortality, and patients with a score of 3 or more had 22% mortality. Similar values were demonstrated in the validation cohort. Table 5 summarizes the sensitivity, specificity, PPVs, and NPVs of each CURB-65 score for 30-day mortality in both cohorts. As we would expect from a good predictive model, the sensitivity starts out very high and decreases with increasing score, while the specificity starts out very low and increases with increasing score. For the clinical application of their model, the authors selected the cut points of 1, 2, and 3 (see Figure 2).

In conclusion, CURB-65 is a simple 5-variable decision aid that is helpful in the initial stratification of mortality risk in patients with CAP.

The wide range of specificities and sensitivities at different values of the CURB-65 score makes it a robust tool for risk stratification. The authors felt that patients with a score of 0-1 were “likely suitable for home treatment,” patients with a score of 2 should have “hospital-supervised treatment,” and patients with score of  ≥ 3 had “severe pneumonia” and should be admitted (with consideration of ICU admission if score of 4 or 5).

Following the publication of the CURB-65 Score, the creator of the Pneumonia Severity Index (PSI) published a prospective cohort study of CAP that examined the discriminatory power (area under the receiver operating characteristic curve) of the PSI vs. CURB-65. His study found that the PSI “has a higher discriminatory power for short-term mortality, defines a greater proportion of patients at low risk, and is slightly more accurate in identifying patients at low risk” than the CURB-65 score.

Expert opinion at UpToDate prefers the PSI over the CURB-65 score based on its more robust base of confirmatory evidence. Of note, the author of the PSI is one of the authors of the relevant UpToDate article. In an important contrast from the CURB-65 authors, these experts suggest that patients with a CURB-65 score of 0 be managed as outpatients, while patients with a score of 1 and above “should generally be admitted.”

Further Reading/References:
1. Original publication of the PSI, NEJM (1997)
2. PSI vs. CURB-65 (2005)
3. CURB-65 @ Wiki Journal Club
4. CURB-65 @ 2 Minute Medicine
5. UpToDate, “CAP in adults: assessing severity and determining the appropriate level of care”

Summary by Duncan F. Moore, MD

Week 13 – VERT

“Effects of Risedronate Treatment on Vertebral and Nonvertebral Fractures in Women With Postmenopausal Osteoporosis”

by the Vertebral Efficacy with Risedronate Therapy (VERT) Study Group

JAMA. 1999 Oct 13;282(14):1344-52. [free full text]

Bisphosphonates are a highly effective and relatively safe class of medications for the prevention of fractures in patients with osteoporosis. The VERT trial published in 1999 was a landmark trial that demonstrated this protective effect with the daily oral bisphosphonate risedronate.

The trial enrolled post-menopausal women with either 2 or more vertebral fractures per radiography or 1 vertebral fracture with decreased lumbar spine bone mineral density. Patients were randomized to the treatment arm (risedronate 2.5mg PO daily or risedronate 5mg PO daily) to the daily PO placebo control arm. Measured outcomes included: 1) the prevalence of new vertebral fracture at 3 years follow-up, per annual imaging, 2) the prevalence of new non-vertebral fracture at 3 years follow-up, per annual imaging, and 3) change in bone mineral density, per DEXA q6 months.

2458 patients were randomized. During the course of the study, “data from other trials indicated that the 2.5mg risedronate dose was less effective than the 5mg dose,” and thus the authors discontinued further data collection on the 2.5mg treatment arm at 1 year into the study. All treatment groups had similar baseline characteristics. 55% of the placebo group and 60% of the 5mg risedronate group completed 3 years of treatment. The prevalence of new vertebral fracture within 3 years was 11.3% in the risedronate group and 16.3% in the placebo group (RR 0.59, 95% CI 0.43-0.82, p = 0.003; NNT = 20). The prevalence of new non-vertebral fractures at 3 years was 5.2% in the treatment arm and 8.4% in the placebo arm (RR 0.6, 95% CI 0.39-0.94, p = 0.02; NNT = 31). Regarding bone mineral density (BMD), see Figure 4 for a visual depiction of the changes in BMD by treatment group at the various 6-month timepoints. Notably, change from baseline BMD of the lumbar spine and femoral neck was significantly higher (and positive) in the risedronate 5mg group at all follow-up timepoints relative to the placebo group and at all timepoints except 6 months for the femoral trochanter measurements. Regarding adverse events, there was no difference in the incidence of upper GI adverse events among the two groups. GI complaints “were the most common adverse events associated with study discontinuance,” and GI events lead to 42% of placebo withdrawals but only 36% of the 5mg risedronate withdrawals.

Oral risedronate reduces the risk of vertebral and non-vertebral fractures in patients with osteoporosis while increasing bone mineral density. Overall, this was a large, well-designed RCT that demonstrated a concrete treatment benefit. As a result, oral bisphosphonate therapy has become the standard of care both for treatment and prevention of osteoporosis. This study, as well as others, demonstrated that such therapies are well-tolerated with relatively few side effects. A notable strength of this study is that it did not exclude patients with GI comorbidities.  One weakness is the modification of the trial protocol to eliminate the risedronate 2.5mg treatment arm after 1 year of study. Although this arm demonstrated a reduction in vertebral fracture at 1 year relative to placebo (p = 0.02), its elimination raises suspicion that the pre-specified analyses were not yielding the anticipated results during the interim analysis and thus the less-impressive treatment arm was discarded.

Further Reading/References:
1. Weekly alendronate vs. weekly risedronate
2. Comparative effectiveness of pharmacologic treatments to prevent fractures: an updated systematic review (2014)

Summary by Duncan F. Moore, MD

Image Credit: Nick Smith, CC BY-SA 3.0, via Wikimedia Commons