Week 29 – PneumA

“Comparison of 8 vs 15 Days of Antibiotic Therapy for Ventilator-Associated Pneumonia in Adults”

JAMA. 2003 November 19;290(19):2588-2598. [free full text]

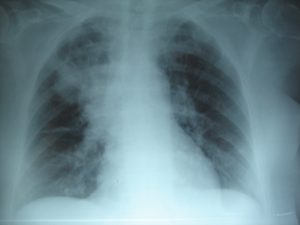
Ventilator-associated pneumonia (VAP) is a frequent complication of mechanical ventilation and, prior to this study, few trials had addressed the optimal duration of antibiotic therapy in VAP. Thus, patients frequently received 14- to 21-day antibiotic courses. As antibiotic stewardship efforts increased and awareness grew of the association between prolonged antibiotic courses and the development of multidrug resistant (MDR) infections, more data were needed to clarify the optimal VAP treatment duration.

This 2003 trial by the PneumA Trial Group was the first large randomized trial to compare shorter (8-day) versus longer (15-day) treatment courses for VAP.

The noninferiority study, carried out in 51 French ICUs, enrolled intubated patients with clinical suspicion for VAP and randomized them to either 8 or 15 days of antimicrobials. Antimicrobial regimens were chosen by the treating clinician. 401 patients met eligibility criteria. 197 were randomized to the 8-day regimen. 204 patients were randomized to the 15-day regimen. Study participants were blinded to randomization assignment until day 8. Analysis was performed using an intention-to-treat model. The primary outcomes measured were death from any cause at 28 days, antibiotic-free days, and microbiologically documented pulmonary infection recurrence.

Study findings demonstrated a similar 28-day mortality in both groups (18.8% mortality in 8-day group vs. 17.2% in 15-day group, group difference 90% CI -3.7% to 6.9%). The 8-day group did not develop more recurrent infections (28.9% in 8-day group vs. 26.0% in 15-day group, group difference 90% CI -3.2% to 9.1%). The 8-day group did have more antibiotic-free days when measured at the 28-day point (13.1 in 8-day group vs. 8.7 in 15-day group, p<0.001). A subgroup analysis did show that more 8-day-group patients who had an initial infection with lactose-nonfermenting GNRs developed a recurrent pulmonary infection, so noninferiority was not established in this specific subgroup (40.6% recurrent GNR infection in 8-day group vs. 25.4% in 15-day group, group difference 90% CI 3.9% to 26.6%).

Implications/Discussion:
There is no benefit to prolonging VAP treatment to 15 days (except perhaps when Pseudomonas aeruginosa is suspected based on gram stain/culture data). Shorter courses of antibiotics for VAP treatment allow for less antibiotic exposure without increasing rates of recurrent infection or mortality.

The 2016 IDSA guidelines on VAP treatment recommend a 7-day course of antimicrobials for treatment of VAP (as opposed to a longer treatment course such as 8-15 days). These guidelines are based on the IDSA’s own large meta-analysis (of 10 randomized trials, including PneumA, as well as an observational study) which demonstrated that shorter courses of antibiotics (7 days) reduce antibiotic exposure and recurrent pneumonia due to MDR organisms without affecting clinical outcomes, such as mortality. Of note, this 7-day course recommendation also applies to treatment of lactose-nonfermenting GNRs, such as Pseudomonas.

When considering the PneumA trial within the context of the newest IDSA guidelines, we see that we now have over 15 years of evidence supporting the use of shorter VAP treatment courses.

Further Reading/References:
1. 2016 IDSA Guidelines for the Management of HAP/VAP
2. Wiki Journal Club
3. PulmCCM “IDSA Guidelines 2016: HAP, VAP & It’s the End of HCAP as We Know It (And I Feel Fine)”
4. PulmCrit “The siren’s call: Double-coverage for ventilator associated PNA”

Summary by Liz Novick, MD

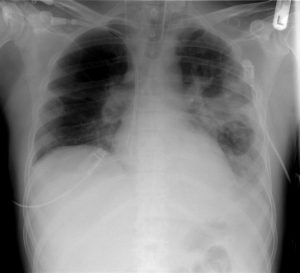
Image Credit: Joseaperez, CC BY-SA 3.0, via Wikimedia Commons

Week 28 – Symptom-Triggered Benzodiazepines in Alcohol Withdrawal

“Symptom-Triggered vs Fixed-Schedule Doses of Benzodiazepine for Alcohol Withdrawal”

Arch Intern Med. 2002 May 27;162(10):1117-21. [free full text]

Treatment of alcohol withdrawal with benzodiazepines has been the standard of care for decades. However, in the 1990s, benzodiazepine therapy for alcohol withdrawal was generally given via fixed doses. In 1994, a double-blind RCT by Saitz et al. demonstrated that symptom-triggered therapy based on responses to the CIWA-Ar scale reduced treatment duration and the amount of benzodiazepine used relative to a fixed-schedule regimen. This trial had little immediate impact in the treatment of alcohol withdrawal. The authors of the 2002 double-blind RCT sought to confirm the findings from 1994 in a larger population that did not exclude patients with a history of seizures or severe alcohol withdrawal.

The trial enrolled consecutive patients admitted to the inpatient alcohol treatment units at two European universities (excluding those with “major cognitive, psychiatric, or medical comorbidity”) and randomized them to treatment with either scheduled placebo (30mg q6hrs x4, followed by 15mg q6hrs x8) with additional PRN oxazepam 15mg for CIWA score 8-15 and 30mg for CIWA score > 15 or to treatment with scheduled oxazepam (30mg q6hrs x4, followed by 15mg q6hrs x8) with additional PRN oxazepam 15mg for CIWA score 8-15 and 30mg for CIWA score > 15.

The primary outcomes were cumulative oxazepam dose at 72 hours and duration of treatment with oxazepam. Subgroup analysis included the exclusion of symptomatic patients who did not require any oxazepam. Secondary outcomes included incidence of seizures, hallucinations, and delirium tremens at 72 hours.

Results:
117 patients completed the trial. 56 had been randomized to the symptom-triggered group, and 61 had been randomized to the fixed-schedule group. The groups were similar in all baseline characteristics except that the fixed-schedule group had on average a 5-hour longer interval since last drink prior to admission. While only 39% of the symptom-triggered group actually received oxazepam, 100% of the fixed-schedule group did (p < 0.001). Patients in the symptom-triggered group received a mean cumulative dose of 37.5mg versus 231.4mg in the fixed-schedule group (p < 0.001). The mean duration of oxazepam treatment was 20.0 hours in the symptom-triggered group versus 62.7 hours in the fixed-schedule group. The group difference in total oxazepam dose persisted even when patients who did not receive any oxazepam were excluded. Among patients who did receive oxazepam, patients in the symptom-triggered group received 95.4 ± 107.7mg versus 231.4 ± 29.4mg in the fixed-dose group (p < 0.001). Only one patient in the symptom-triggered group sustained a seizure. There were no seizures, hallucinations, or episodes of delirium tremens in any of the other 116 patients. The two treatment groups had similar quality-of-life and symptom scores aside from slightly higher physical functioning in the symptom-triggered group (p < 0.01). See Table 2.

Implication/Discussion:
Symptom-triggered administration of benzodiazepines in alcohol withdrawal led to a six-fold reduction in cumulative benzodiazepine use and a much shorter duration of pharmacotherapy than fixed-schedule administration. This more restrictive and responsive strategy did not increase the risk of major adverse outcomes such as seizure or DTs and also did not result in increased patient discomfort.

Overall, this study confirmed the findings of the landmark study by Saitz et al. from eight years prior. Additionally, this trial was larger and did not exclude patients with a prior history of withdrawal seizures or severe withdrawal. The fact that both studies took place in inpatient specialty psychiatry units limits their generalizability to our inpatient general medicine populations.

Why the initial 1994 study did not gain clinical traction remains unclear. Both studies have been well-cited over the ensuing decades, and the paradigm has shifted firmly toward symptom-triggered benzodiazepine regimens using the CIWA scale. While a 2010 Cochrane review cites only the 1994 study, Wiki Journal Club and 2 Minute Medicine have entries on this 2002 study but not on the equally impressive 1994 study.

Further Reading/References:
1. “Individualized treatment for alcohol withdrawal. A randomized double-blind controlled trial.” JAMA. 1994.
2. Clinical Institute Withdrawal Assessment of Alcohol Scale, Revised (CIWA-Ar)
3. Wiki Journal Club
4. 2 Minute Medicine
5. “Benzodiazepines for alcohol withdrawal.” Cochrane Database Syst Rev. 2010

Summary by Duncan F. Moore, MD

Image Credit: VisualBeo, CC BY-SA 3.0, via Wikimedia Commons

Week 25 – ALLHAT

“Major Outcomes in High-Risk Hypertensive Patients Randomized to Angiotensin-Converting Enzyme Inhibitor or Calcium Channel Blocker vs. Diuretic”

The Antihypertensive and Lipid-Lowering Treatment to Prevent Heart Attack Trial (ALLHAT)

JAMA. 2002 Dec 18;288(23):2981-97. [free full text]

Hypertension is a ubiquitous disease, and the cardiovascular and mortality benefits of BP control have been well described. However, as the number of available antihypertensive classes proliferated in the past several decades, a head-to-head comparison of different antihypertensive regimens was necessary to determine the optimal first-step therapy. The 2002 ALLHAT trial was a landmark trial in this effort.

Population:
33,357 patients aged 55 years or older with hypertension and at least one other coronary heart disease (CHD) risk factor (previous MI or stroke, LVH by ECG or echo, T2DM, current cigarette smoking, HDL < 35 mg/dL, or documentation of other atherosclerotic cardiovascular disease (CVD)). Notable exclusion criteria: history of hospitalization for CHF, history of treated symptomatic CHF, or known LVEF < 35%.

Intervention:
Prior antihypertensives were discontinued upon initiation of the study drug. Patients were randomized to one of three study drugs in a double-blind fashion. Study drugs and additional drugs were added in a step-wise fashion to achieve a goal BP < 140/90 mmHg.

Step 1: titrate assigned study drug

  • chlorthalidone: 12.5 –> 5 (sham titration) –> 25 mg/day
  • amlodipine: 2.5 –> 5 –>  10 mg/day
  • lisinopril: 10 –> 20 –> 40 mg/day

Step 2: add open-label agents at treating physician’s discretion (atenolol, clonidine, or reserpine)

  • atenolol: 25 to 100 mg/day
  • reserpine: 0.05 to 0.2 mg/day
  • clonidine: 0.1 to 0.3 mg BID

Step 3: add hydralazine 25 to 100 mg BID

Comparison:
Pairwise comparisons with respect to outcomes of chlorthalidone vs. either amlodipine or lisinopril. A doxazosin arm existed initially, but it was terminated early due to an excess of CV events, primarily driven by CHF.

Outcomes:
Primary –  combined fatal CAD or nonfatal MI

Secondary

  • all-cause mortality
  • fatal and nonfatal stroke
  • combined CHD (primary outcome, PCI, or hospitalized angina)
  • combined CVD (CHD, stroke, non-hospitalized treated angina, CHF [fatal, hospitalized, or treated non-hospitalized], and PAD)

Results:
Over a mean follow-up period of 4.9 years, there was no difference between the groups in either the primary outcome or all-cause mortality.

When compared with chlorthalidone at 5 years, the amlodipine and lisinopril groups had significantly higher systolic blood pressures (by 0.8 mmHg and 2 mmHg, respectively). The amlodipine group had a lower diastolic blood pressure when compared to the chlorthalidone group (0.8 mmHg).

When comparing amlodipine to chlorthalidone for the pre-specified secondary outcomes, amlodipine was associated with an increased risk of heart failure (RR 1.38; 95% CI 1.25-1.52).

When comparing lisinopril to chlorthalidone for the pre-specified secondary outcomes, lisinopril was associated with an increased risk of stroke (RR 1.15; 95% CI 1.02-1.30), combined CVD (RR 1.10; 95% CI 1.05-1.16), and heart failure (RR 1.20; 95% CI 1.09-1.34). The increased risk of stroke was mostly driven by 3 subgroups: women (RR 1.22; 95% CI 1.01-1.46), blacks (RR 1.40; 95% CI 1.17-1.68), and non-diabetics (RR 1.23; 95% CI 1.05-1.44). The increased risk of CVD was statistically significant in all subgroups except in patients aged less than 65. The increased risk of heart failure was statistically significant in all subgroups.

Discussion:
In patients with hypertension and one risk factor for CAD, chlorthalidone, lisinopril, and amlodipine performed similarly in reducing the risks of fatal CAD and nonfatal MI.

The study has several strengths: a large and diverse study population, a randomized, double-blind structure, and the rigorous evaluation of three of the most commonly prescribed “newer” classes of antihypertensives. Unfortunately, neither an ARB nor an aldosterone antagonist was included in the study. Additionally, the step-up therapies were not reflective of contemporary practice. (Instead, patients would likely be prescribed one or more of the primary study drugs.)

The ALLHAT study is one of the hallmark studies of hypertension and has played an important role in hypertension guidelines since it was published. Following the publication of ALLHAT, thiazide diuretics became widely used as first line drugs in the treatment of hypertension. The low cost of thiazides and their limited side-effect profile are particularly attractive class features. While ALLHAT looked specifically at chlorthalidone, in practice the positive findings were attributed to HCTZ, which has been more often prescribed. The authors of ALLHAT argued that the superiority of thiazides was likely a class effect, but according to the analysis at Wiki Journal Club, “there is little direct evidence that HCTZ specifically reduces the incidence of CVD among hypertensive individuals.” Furthermore, a 2006 study noted that that HCTZ has worse 24-hour BP control than chlorthalidone due to a shorter half-life. The ALLHAT authors note that “since a large proportion of participants required more than 1 drug to control their BP, it is reasonable to infer that a diuretic be included in all multi-drug regimens, if possible.” The 2017 ACC/AHA High Blood Pressure Guidelines state that, of the four thiazide diuretics on the market, chlorthalidone is preferred because of a prolonged half-life and trial-proven reduction of CVD (via the ALLHAT study).

Further Reading / References:
1. 2017 ACC Hypertension Guidelines
2. Wiki Journal Club
3. 2 Minute Medicine
4. Ernst et al, “Comparative antihypertensive effects of hydrochlorothiazide and chlorthalidone on ambulatory and office blood pressure.” (2006)
5. Gillis Pharmaceuticals [https://www.youtube.com/watch?v=HOxuAtehumc]
6. Concepts in Hypertension, Volume 2 Issue 6

Summary by Ryan Commins MD

Image Credit: Kimivanil, CC BY-SA 4.0, via Wikimedia Commons

Week 17 – 4S

“Randomised trial of cholesterol lowering in 4444 patients with coronary heart disease: the Scandinavian Simvastatin Survival Study (4S)”

Lancet. 1994 Nov 19;344(8934):1383-9 [free full text]

Statins are an integral part of modern primary and secondary prevention of atherosclerotic cardiovascular disease (ASCVD). Hypercholesterolemia is regarded as a major contributory factor to the development of atherosclerosis, and in the 1980s, a handful of clinical trials demonstrated reduction in MI/CAD incidence with cholesterol-lowering agents, such as cholestyramine and gemfibrozil. However, neither drug demonstrated a mortality benefit. By the late 1980s, there was much hope that the emerging drug class of HMG-CoA reductase inhibitors (statins) would confer a mortality benefit, given their previously demonstrated LDL-lowering effects. The 1994 Scandinavian Simvastatin Survival Study was the first large clinical trial to assess this hypothesis.

4444 adults ages 35-70 with a history of angina pectoris or MI and elevated serum total cholesterol (212 – 309 mg/dL) were recruited from 94 clinical centers in Scandinavia (and in Finland, which is technically a Nordic country but not a Scandinavian country…) and randomized to treatment with either simvastatin 20mg PO qPM or placebo. Dosage was increased at 12 weeks and 6 months to target a serum total cholesterol of 124 to 201 mg/dL. (Placebo patients were randomly uptitrated as well.) The primary endpoint was all-cause mortality. The secondary endpoint was time to first “major coronary event,” which included coronary deaths, nonfatal MI, resuscitated cardiac arrest, and definite silent MI per EKG.

The study was stopped early in 1994 after an interim analysis demonstrated a significant survival benefit in the treatment arm. At a mean 5.4 years of follow-up, 256 (12%) in the placebo group versus 182 (8%) in the simvastatin group had died (RR 0.70, 95% CI 0.58-0.85, p=0.0003, NNT = 30.1). The mortality benefit was driven exclusively by a reduction in coronary deaths. Dropout rates were similar (13% of placebo group and 10% of simvastatin group). The secondary endpoint, occurrence of a major coronary event, occurred in 622 (28%) of the placebo group and 431 (19%) of the simvastatin group (RR 0.66, 95% CI 0.59-0.75, p < 0.00001). Subgroup analyses of women and patients aged 60+ demonstrated similar findings for the primary and secondary outcomes. Over the entire course of the study, the average changes in lipid values from baseline in the simvastatin group were -25% total cholesterol, -35% LDL, +8% HDL, and -10% triglycerides. The corresponding percent changes from baseline in the placebo group were +1%, +1%, +1%, and +7%, respectively.

In conclusion, simvastatin therapy reduced mortality in patients with known CAD and hypercholesterolemia via reduction of major coronary events. This was a large, well-designed, double-blind RCT that ushered in the era of widespread statin use for secondary, and eventually, primary prevention of ASCVD. For further information about modern guidelines for the use of statins, please see the 2013 “ACC/AHA Guideline on the Treatment of Blood Cholesterol to Reduce Atherosclerotic Cardiovascular Risk in Adults” and the 2016 USPSTF guideline “Statin use for the Primary Prevention of Cardiovascular Disease in Adults: Preventive Medication”.

Finally, for history buffs interested in a brief history of the discovery and development of this drug class, please see this paper by Akira Endo.

References / Additional Reading:
1. 4S @ Wiki JournalClub
2. “2013 ACC/AHA Guideline on the Treatment of Blood Cholesterol to Reduce Atherosclerotic Cardiovascular Risk in Adults”
3. “Statin use for the Primary Prevention of Cardiovascular Disease in Adults: Preventive Medication” (2016)
4. UpToDate, “Society guideline links: Lipid disorders in adults”
5. “A historical perspective on the discovery of statins” (2010)

Summary by Duncan F. Moore, MD

Image Credit: Siol, CC BY-SA 3.0, via Wikimedia Commons

Week 16 – MELD

“A Model to Predict Survival in Patients With End-Stage Liver Disease”

Hepatology. 2001 Feb;33(2):464-70. [free full text]

Prior to the adoption of the Model for End-Stage Liver Disease (MELD) score for the allocation of liver transplants, the determination of medical urgency was dependent on the Child-Pugh score. The Child-Pugh score was limited by the inclusion of two subjective variables (severity of ascites and severity of encephalopathy), limited discriminatory ability, and a ceiling effect of laboratory abnormalities. Stakeholders sought an objective, continuous, generalizable index that more accurately and reliably represented disease severity. The MELD score had originally been developed in 2000 to estimate the survival of patients undergoing TIPS. The authors of this 2001 study hypothesized that the MELD score would accurately estimate short-term survival in a wide range of severities and etiologies of liver dysfunction and thus serve as a suitable replacement measure for the Child-Pugh score in the determination of medical urgency in transplant allocation.

This study reported a series of four retrospective validation cohorts for the use of MELD in prediction of mortality in advanced liver disease. The index MELD score was calculated for each patient. Death during follow-up was assessed by chart review.

MELD score = 3.8*ln([bilirubin])+11.2*ln(INR)+9.6*ln([Cr])+6.4*(etiology: 0 if cholestatic or alcoholic, 1 otherwise)

The primary study outcome was the concordance c-statistic between MELD score and 3-month survival. The c-statistic is equivalent to the area under receiver operating characteristic (AUROC). Per the authors, “a c-statistic between 0.8 and 0.9 indicates excellent diagnostic accuracy and a c-statistic greater than 0.7 is generally considered as a useful test.” (See page 455 for further explanation.) There was no reliable comparison statistic (e.g. c-statistic of MELD vs. that of Child-Pugh in all groups).

C-statistic for 3-month survival in the four cohorts ranged from 0.78 to 0.87 (no 95% CIs exceeded 1.0). There was minimal improvement in the c-statistics for 3-month survival with the individual addition of spontaneous bacterial peritonitis, variceal bleed, ascites, and encephalopathy to the MELD score (see Table 4, highest increase in c-statistic was 0.03). When the etiology of liver disease was excluded from the MELD score, there was minimal change in the c-statistics (see Table 5, all paired CIs overlap). C-statistics for 1-week mortality ranged from 0.80 to 0.95.

In conclusion, the MELD score is an excellent predictor of short-term mortality in patients with end-stage liver disease of diverse etiology and severity. Despite the retrospective nature of this study, this study represented a significant improvement upon the Child-Pugh score in determining medical urgency in patients who require liver transplant. In 2002, the United Network for Organ Sharing (UNOS) adopted a modified version of the MELD score for the prioritization of deceased-donor liver transplants in cirrhosis. Concurrent with the 2001 publication of this study, Wiesner et al. performed a prospective validation of the use of MELD in the allocation of liver transplantation. When published in 2003, it demonstrated that MELD score accurately predicted 3-month mortality among patients with chronic liver disease on the waitlist. The MELD score has also been validated in other conditions such as alcoholic hepatitis, hepatorenal syndrome, and acute liver failure (see UpToDate). Subsequent additions to the MELD score have come out over the years. In 2006, the MELD Exception Guidelines offered extra points for severe comorbidities (e.g HCC, hepatopulmonary syndrome). In January 2016, the MELDNa score was adopted and is now used for liver transplant prioritization.

References and Further Reading:
1. “A model to predict poor survival in patients undergoing transjugular intrahepatic portosystemic shunts” (2000)
2. MDCalc “MELD Score”
3. Wiesner et al. “Model for end-stage liver disease (MELD) and allocation of donor livers” (2003)
4. Freeman Jr. et al. “MELD exception guidelines” (2006)
5. 2 Minute Medicine
6. UpToDate “Model for End-stage Liver Disease (MELD)”

Image Credit: Ed Uthman, CC-BY-2.0, via WikiMedia Commons

Week 15 – CHADS2

“Validation of Clinical Classification Schemes for Predicting Stroke”

JAMA. 2001 June 13;285(22):2864-70. [free full text]

Atrial fibrillation is the most common cardiac arrhythmia and affects 1-2% of the overall population with increasing prevalence as people age. Atrial fibrillation also carries substantial morbidity and mortality due to the risk of stroke and thromboembolism although the risk of embolic phenomenon varies widely across various subpopulations. In 2001, the only oral anticoagulation options available were warfarin and aspirin, which had relative risk reductions of 62% and 22%, respectively, consistent across these subpopulations. Clinicians felt that high risk patients should be anticoagulated, but the two common classification schemes, AFI and SPAF, were flawed. Patients were often classified as low risk in one scheme and high risk in the other. The schemes were derived retrospectively and were clinically ambiguous. Therefore, in 2001, a group of investigators combined the two existing schemes to create the CHADS2 scheme and applied it to a new data set.

Population (NRAF cohort): Hospitalized Medicare patients ages 65-95 with non-valvular AF not prescribed warfarin at hospital discharge.

Intervention: Determination of CHADS2 score (1 point for recent CHF, hypertension, age ≥ 75, and DM; 2 points for a history of stroke or TIA)

Comparison: AFI and SPAF risk schemes

Measured Outcome: Hospitalization rates for ischemic stroke (per ICD-9 codes from Medicare claims), stratified by CHADS2 / AFI / SPAF scores.

Calculated Outcome: performance of the various schemes, based on c statistic (a measure of predictive accuracy in a binary logistic regression model)

Results:
1733 patients were identified in the NRAF cohort. When compared to the AFI and SPAF trials, these patients tended be older (81 in NRAF vs. 69 in AFI vs. 69 in SPAF), have a higher burden of CHF (56% vs. 22% vs. 21%), are more likely to be female (58% vs. 34% vs. 28%), and have a history of DM (23% vs. 15% vs. 15%) or prior stroke/TIA (25% vs. 17% vs. 8%). The stroke rate was lowest in the group with a CHADS2 = 0 (1.9 per 100 patient years, adjusting for the assumption that aspirin was not taken). The stroke rate increased by a factor of approximately 1.5 for each 1-point increase in the CHADS2 score.

CHADS2 score           NRAF Adjusted Stroke Rate per 100 Patient-Years
0                                      1.9
1                                      2.8
2                                      4.0
3                                      5.9
4                                      8.5
5                                      12.5
6                                      18.2

The CHADS2 scheme had a c statistic of 0.82 compared to 0.68 for the AFI scheme and 0.74 for the SPAF scheme.

Implication/Discussion
The CHADS2 scheme provides clinicians with a scoring system to help guide decision making for anticoagulation in patients with non-valvular AF.

The authors note that the application of the CHADS2 score could be useful in several clinical scenarios. First, it easily identifies patients at low risk of stroke (CHADS2 = 0) for whom anticoagulation with warfarin would probably not provide significant benefit. The authors argue that these patients should merely be offered aspirin. Second, the CHADS2 score could facilitate medication selection based on a patient-specific risk of stroke. Third, the CHADS2 score could help clinicians make decisions regarding anticoagulation in the perioperative setting by evaluating the risk of stroke against the hemorrhagic risk of the procedure. Although the CHADS2 is no longer the preferred risk-stratification scheme, the same concepts are still applicable to the more commonly used CHA2DS2-VASc.

This study had several strengths. First, the cohort was from seven states that represented all geographic regions of the United States. Second, CHADS2 was pre-specified based on previous studies and validated using the NRAF data set. Third, the NRAF data set was obtained from actual patient chart review as opposed to purely from an administrative database. Finally, the NRAF patients were older and sicker than those of the AFI and SPAF cohorts, and thus the CHADS2 appears to be generalizable to the very large demographic of frail, elderly Medicare patients.

As CHADS2 became widely used clinically in the early 2000s, its application to other cohorts generated a large intermediate-risk group (CHADS2 = 1), which was sometimes > 60% of the cohort (though in the NRAF cohort, CHADS2 = 1 accounted for 27% of the cohort). In clinical practice, this intermediate-risk group was to be offered either warfarin or aspirin. Clearly, a clinical-risk predictor that does not provide clear guidance in over 50% of patients needs to be improved. As a result, the CHA2DS2-VASc scoring system was developed from the Birmingham 2009 scheme. When compared head-to-head in registry data, CHA2DS2-VASc more effectively discriminated stroke risk among patients with a baseline CHADS2 score of 0 to 1. Because of this, CHA2DS2-VASc is the recommended risk stratification scheme in the AHA/ACC/HRS 2014 Practice Guideline for Atrial Fibrillation. In modern practice, anticoagulation is unnecessary when CHA2DS2-VASc score = 0, should be considered (vs. antiplatelet or no treatment) when score = 1, and is recommended when score ≥ 2.

Further Reading:
1. AHA/ACC/HRS 2014 Practice Guideline for Atrial Fibrillation
2. CHA2DS2-VASc (2010)
3. 2 Minute Medicine

Summary by Ryan Commins, MD

Image Credit: Alisa Machalek, NIGMS/NIH – National Insititue of General Medical Sciences, Public Domain

Week 14 – CURB-65

“Defining community acquired pneumonia severity on presentation to hospital: an international derivation and validation study”

Thorax. 2003 May;58(5):377-82. [free full text]

Community-acquired pneumonia (CAP) is frequently encountered by the admitting medicine team. Ideally, the patient’s severity at presentation and risk for further decompensation should determine the appropriate setting for further care, whether as an outpatient, on an inpatient ward, or in the ICU. At the time of this 2003 study, the predominant decision aid was the 20-variable Pneumonia Severity Index. The authors of this study sought to develop a simpler decision aid for determining the appropriate level of care at presentation.

The study examined the 30-day mortality rates of adults admitted for CAP via the ED at three non-US academic medical centers (data from three previous CAP cohort studies). 80% of the dataset was analyzed as a derivation cohort – meaning it was used to identify statistically significant, clinically relevant prognostic factors that allowed for mortality risk stratification. The resulting model was applied to the remaining 20% of the dataset (the validation cohort) in order to assess the accuracy of its predictive ability.

The following variables were integrated into the final model (CURB-65):

  1. Confusion
  2. Urea > 19mg/dL (7 mmol/L)
  3. Respiratory rate ≥ 30 breaths/min
  4. low Blood pressure (systolic BP < 90 mmHg or diastolic BP < 60 mmHg)
  5. age ≥ 65

1068 patients were analyzed. 821 (77%) were in the derivation cohort. 86% of patients received IV antibiotics, 5% were admitted to the ICU, and 4% were intubated. 30-day mortality was 9%. 9 of 11 clinical features examined in univariate analysis were statistically significant (see Table 2).

Ultimately, using the above-described CURB-65 model, in which 1 point is assigned for each clinical characteristic, patients with a CURB-65 score of 0 or 1 had 1.5% mortality, patients with a score of 2 had 9.2% mortality, and patients with a score of 3 or more had 22% mortality. Similar values were demonstrated in the validation cohort. Table 5 summarizes the sensitivity, specificity, PPVs, and NPVs of each CURB-65 score for 30-day mortality in both cohorts. As we would expect from a good predictive model, the sensitivity starts out very high and decreases with increasing score, while the specificity starts out very low and increases with increasing score. For the clinical application of their model, the authors selected the cut points of 1, 2, and 3 (see Figure 2).

In conclusion, CURB-65 is a simple 5-variable decision aid that is helpful in the initial stratification of mortality risk in patients with CAP.

The wide range of specificities and sensitivities at different values of the CURB-65 score makes it a robust tool for risk stratification. The authors felt that patients with a score of 0-1 were “likely suitable for home treatment,” patients with a score of 2 should have “hospital-supervised treatment,” and patients with score of  ≥ 3 had “severe pneumonia” and should be admitted (with consideration of ICU admission if score of 4 or 5).

Following the publication of the CURB-65 Score, the author of the Pneumonia Severity Index (PSI) published a prospective cohort study of CAP that examined the discriminatory power (area under the receiver operating characteristic curve) of the PSI vs. CURB-65. His study found that the PSI “has a higher discriminatory power for short-term mortality, defines a greater proportion of patients at low risk, and is slightly more accurate in identifying patients at low risk” than the CURB-65 score.

Expert opinion at UpToDate prefers the PSI over the CURB-65 score based on its more robust base of confirmatory evidence. Of note, the author of the PSI is one of the authors of the relevant UpToDate article. In an important contrast from the CURB-65 authors, these experts suggest that patients with a CURB-65 score of 0 be managed as outpatients, while patients with a score of 1 and above “should generally be admitted.”

Further Reading/References:
1. Original publication of the PSI, NEJM (1997)
2. PSI vs. CURB-65 (2005)
3. Wiki Journal Club
4. 2 Minute Medicine
5. UpToDate, “CAP in adults: assessing severity and determining the appropriate level of care”

Summary by Duncan F. Moore, MD

Image Credit: by Christaras A, CC BY-SA 3.0

Week 13 – Sepsis-3

“The Third International Consensus Definitions for Sepsis and Septic Shock (Sepsis-3)”

JAMA. 2016 Feb 23;315(8):801-10. [free full text]

In practice, we recognize sepsis as a potentially life-threatening condition that arises secondary to infection. Because the SIRS criteria were of limited sensitivity and specificity in identifying sepsis and because our understanding of the pathophysiology of sepsis had purportedly advanced significantly during the interval since the last sepsis definition, an international task force of 19 experts was convened to define and prognosticate sepsis more effectively. The resulting 2016 Sepsis-3 definition was the subject of immediate and sustained controversy.

In the words of Sepsis-3, sepsis simply “is defined as life-threatening organ dysfunction caused by a dysregulated host response to infection.” The paper further defines organ dysfunction in terms of a threshold change in the SOFA score by 2+ points. However, the authors state that “the SOFA score is not intended to be used as a tool for patient management but as a means to clinically characterize a septic patient.” The authors note that qSOFA, an easier tool introduced in this paper, can identify promptly at the bedside patients “with suspected infection who are likely to have a prolonged ICU stay or die in the hospital.” A positive screen on qSOFA is identified as 2+ of the following: AMS, SBP ≤ 100, or respiratory rate ≥ 22. At the time of this endorsement of qSOFA, the tool had not been validated prospectively. Finally, septic shock was defined as sepsis with persistent hypotension requiring vasopressors to maintain MAP ≥ 65 and with a serum lactate > 2 despite adequate volume resuscitation.

As noted contemporaneously in the excellent PulmCrit blog post “Top ten problems with the new sepsis definition,” Sepsis-3 was not endorsed by the American College of Chest Physicians, the IDSA, any emergency medicine society, or any hospital medicine society. On behalf of the American College of Chest Physicians, Dr. Simpson published a scathing rejection of Sepsis-3 in Chest in May 2016. He noted “there is still no known precise pathophysiological feature that defines sepsis.” He went on to state “it is not clear to us that readjusting the sepsis criteria to be more specific for mortality is an exercise that benefits patients,” and said “to abandon one system of recognizing sepsis [SIRS] because it is imperfect and not yet in universal use for another system that is used even less seems unwise without prospective validation of that new system’s utility.”

In fact, the later validation of qSOFA demonstrated that the SIRS criteria had superior sensitivity for predicting in-hospital mortality while qSOFA had higher specificity. See the following posts at PulmCrit for further discussion: [https://emcrit.org/isepsis/isepsis-sepsis-3-0-much-nothing/] [https://emcrit.org/isepsis/isepsis-sepsis-3-0-flogging-dead-horse/].

At UpToDate, authors note that “data of the value of qSOFA is conflicting,” and because of this, “we believe that further studies that demonstrate improved clinically meaningful outcomes due to the use of qSOFA compared to clinical judgement are warranted before it can be routinely used to predict those at risk of death from sepsis.”

Additional Reading:
1. PulmCCM, “Simple qSOFA score predicts sepsis as well as anything else”
2. 2 Minute Medicine

Summary by Duncan F. Moore, MD

Image Credit: By Mark Oniffrey – Own work, CC BY-SA 4.0

Week 8 – FUO

“Fever of Unexplained Origin: Report on 100 Cases”

Medicine (Baltimore). 1961 Feb;40:1-30. [free full text]

In our modern usage, fever of unknown origin (FUO) refers to a persistent unexplained fever despite an adequate medical workup. The most commonly used criteria for this diagnosis stem from the 1961 series by Petersdorf and Beeson.

This study analyzed a prospective cohort of patients evaluated at Yale’s hospital for FUO between 1952 and 1957. Their FUO criteria: 1) illness of more than three week’s duration, 2) fever higher than 101º F on several occasions, and 3) diagnosis uncertain after one week of study in hospital. After 126 cases had been noted, retrospective investigation was undertaken to determine the ultimate etiologies of the fevers. The authors winnowed this group to 100 cases based on availability of follow-up data and the exclusion of cases that “represented combinations of such common entities as urinary tract infection and thrombophlebitis.”

In 93 cases, “a reasonably certain diagnosis was eventually possible.” 6 of the 7 undiagnosed patients ultimately made a full recovery. Underlying etiologies (see table 1 on page 3) included: infectious 36% (with TB in 11%), neoplastic diseases 19%, collagen disease (e.g. SLE) 13%, pulmonary embolism 3%, benign non-specific pericarditis 2%, sarcoidosis 2%, hypersensitivity reaction 4%, cranial arteritis 2%, periodic disease 5%, miscellaneous disease 4%, factitious fever 3%, no diagnosis 7%.

Clearly, diagnostic modalities have improved markedly since this 1961 study. However, the core etiologies of infection, malignancy, and connective tissue disease/non-infectious inflammatory disease remain most prominent, while the percentage of patients with no ultimate diagnosis has been increasing (for example, see PMIDs 9413425, 12742800, and 17220753). Modifications to the 1961 criteria have been proposed (for example: 1 week duration of hospital stay not required if certain diagnostic measures have been performed) and implemented in recent FUO trials. One modern definition of FUO: fever ≥ 38.3º C, lasting at least 2-3 weeks, with no identified cause after three days of hospital evaluation or three outpatient visits. Per UpToDate, the following minimum diagnostic workup is recommended in suspected FUO: blood cultures, ESR or CRP, LDH, HIV, RF, heterophile antibody test, CK, ANA, TB testing, SPEP, and CT of abdomen and chest.

Further Reading/References:
1. “Fever of unknown origin (FUO). I A. prospective multicenter study of 167 patients with FUO, using fixed epidemiologic entry criteria. The Netherlands FUO Study Group.” Medicine (Baltimore). 1997 Nov;76(6):392-400.
2. “From prolonged febrile illness to fever of unknown origin: the challenge continues.” Arch Intern Med. 2003 May 12;163(9):1033-41.
3. “A prospective multicenter study on fever of unknown origin: the yield of a structured diagnostic protocol.” Medicine (Baltimore). 2007 Jan;86(1):26-38.
4. UpToDate, “Approach to the Adult with Fever of Unknown Origin”
5. “Robert Petersdorf, 80, Major Force in U.S. Medicine, Dies” The New York Times, 2006.

Summary by Duncan F. Moore, MD

Image Credit: by Menchi @ Wikimedia Commons, CC BY-SA 3.0

Week 50 – Sepsis-3

“The Third International Consensus Definitions for Sepsis and Septic Shock (Sepsis-3)”

JAMA. 2016 Feb 23;315(8):801-10. [free full text]

In practice, we recognize sepsis as a potentially life-threatening condition that arises secondary to infection.  Because the SIRS criteria were of limited sensitivity and specificity in identifying sepsis and because our understanding of the pathophysiology of sepsis had purportedly advanced significantly during the interval since the last sepsis definition, an international task force of 19 experts was convened to define and prognosticate sepsis more effectively. The resulting 2016 Sepsis-3 definition was the subject of immediate and sustained controversy.

In the words of Sepsis-3, sepsis simply “is defined as life-threatening organ dysfunction caused by a dysregulated host response to infection.” The paper further defines organ dysfunction in terms of a threshold change in the SOFA score by 2+ points. However, the authors state that “the SOFA score is not intended to be used as a tool for patient management but as a means to clinically characterize a septic patient.” The authors note that qSOFA, an easier tool introduced in this paper, can identify promptly at the bedside patients “with suspected infection who are likely to have a prolonged ICU stay or die in the hospital.” A positive screen on qSOFA is identified as 2+ of the following: AMS, SBP ≤ 100, or respiratory rate ≥ 22. At the time of this endorsement of qSOFA, the tool had not been validated prospectively. Finally, septic shock was defined as sepsis with persistent hypotension requiring vasopressors to maintain MAP ≥ 65 and with a serum lactate > 2 despite adequate volume resuscitation.

As noted contemporaneously in the excellent PulmCrit blog post “Top ten problems with the new sepsis definition,” Sepsis-3 was not endorsed by the American College of Chest Physicians, the IDSA, any emergency medicine society, or any hospital medicine society. On behalf of the American College of Chest Physicians, Dr. Simpson published a scathing rejection of Sepsis-3 in Chest in May 2016. He noted “there is still no known precise pathophysiological feature that defines sepsis.” He went on to state “it is not clear to us that readjusting the sepsis criteria to be more specific for mortality is an exercise that benefits patients,” and said “to abandon one system of recognizing sepsis [SIRS] because it is imperfect and not yet in universal use for another system that is used even less seems unwise without prospective validation of that new system’s utility.”

In fact, the later validation of qSOFA demonstrated that the SIRS criteria had superior sensitivity for predicting in-hospital mortality while qSOFA had higher specificity. See the following posts at PumCrit for further discussion: [https://emcrit.org/isepsis/isepsis-sepsis-3-0-much-nothing/] [https://emcrit.org/isepsis/isepsis-sepsis-3-0-flogging-dead-horse/].

At UpToDate, authors note that “data of the value of qSOFA is conflicting,” and because of this, “we believe that further studies that demonstrate improved clinically meaningful outcomes due to the use of qSOFA compared to clinical judgement are warranted before it can be routinely used to predict those at risk of death from sepsis.”

Additional Reading:
1. PulmCCM, “Simple qSOFA score predicts sepsis as well as anything else”
2. 2 Minute Medicine

Summary by Duncan F. Moore, MD